Fig. 1.
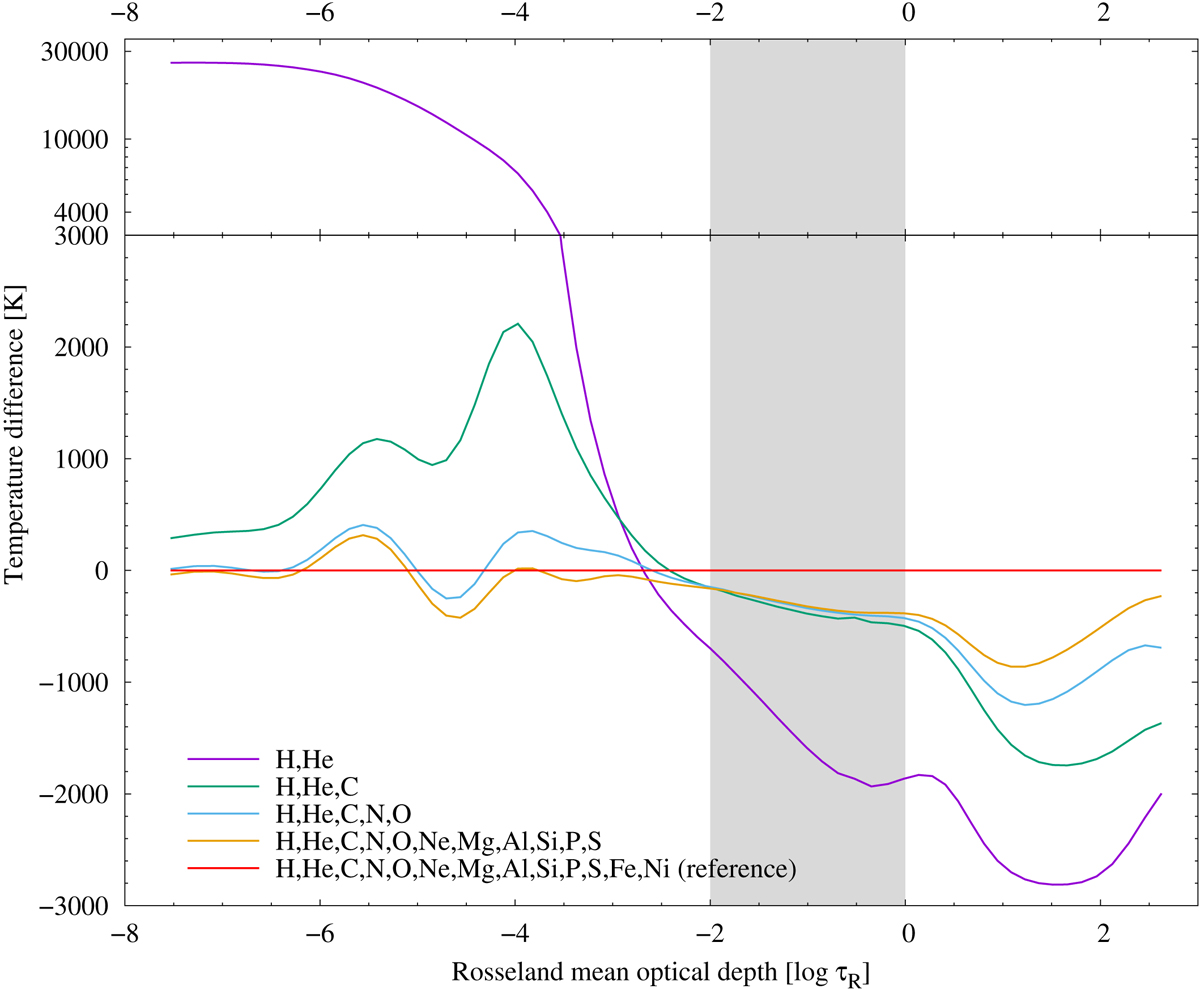
Temperature stratification of Tlusty model atmospheres having different model atoms with respect to a fully line-blanketed reference model (No. 5). The shaded region marks the line forming region in the atmosphere. The y-axis shows the temperature difference with respect to the reference model, while the x-axis gives the Rosseland mean optical depth τR. The figure demonstrates the effects of metal opacities in NLTE atmospheres. The higher the opacity (the more opacity sources included) the cooler the upper atmosphere and the hotter the deeper layers (surface cooling and back warming).
Current usage metrics show cumulative count of Article Views (full-text article views including HTML views, PDF and ePub downloads, according to the available data) and Abstracts Views on Vision4Press platform.
Data correspond to usage on the plateform after 2015. The current usage metrics is available 48-96 hours after online publication and is updated daily on week days.
Initial download of the metrics may take a while.