Fig. 6
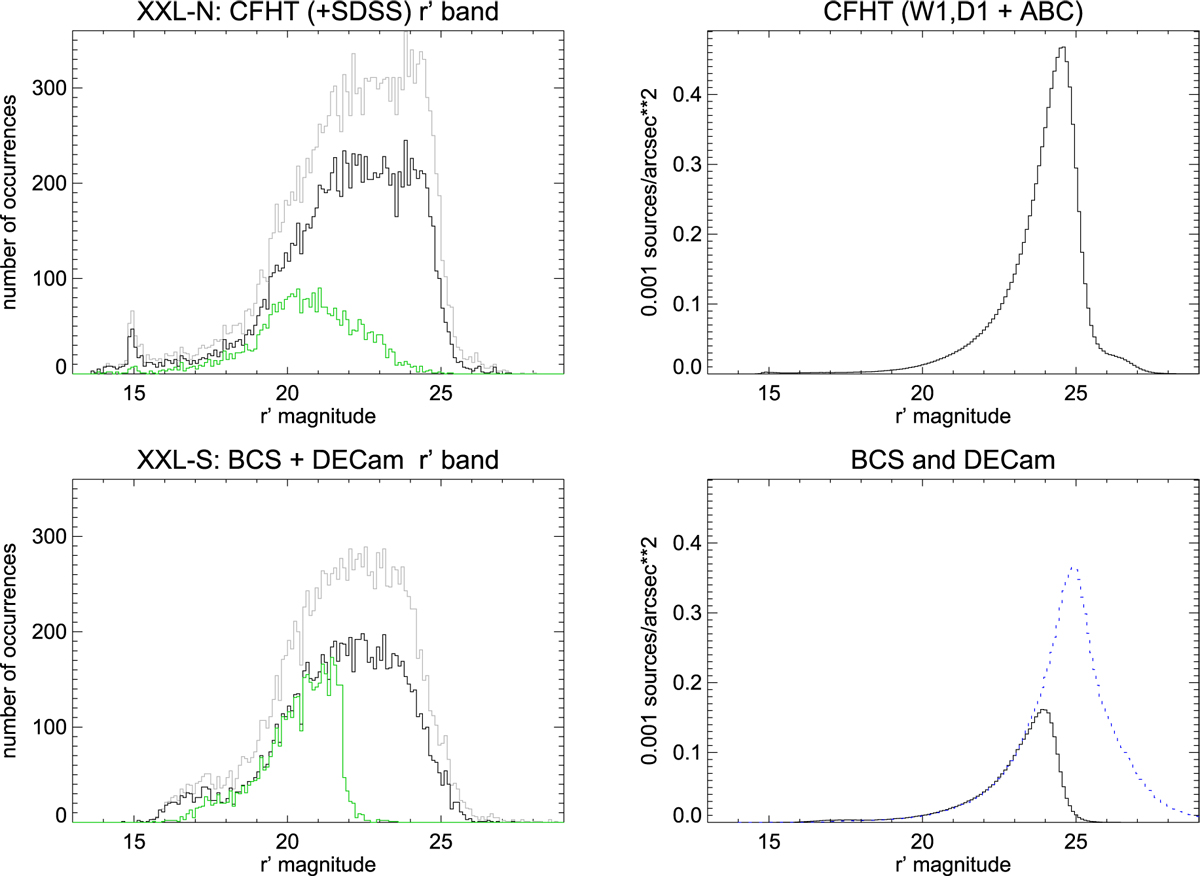
r′-band magnitude distribution for objects in XXL-N (top panels) and XXL-S (bottom panels). Left column: histograms for counterparts: grey refers to all candidate counterparts (primaries and secondaries); black to the primary counterparts; and green to the subset of the primaries with a spectroscopic redshift. Right column: densities n(m) for all objects in specific surveys. For CFHT this amounts to more than 5 million objects in ~43 deg2; for BCS (bottom panel, black solid curve) to approximately 2 million objects in ~47 deg2; and for the deeper DECam survey (dashed blue curve) to approximately 2 million in just ~16 deg2.
Current usage metrics show cumulative count of Article Views (full-text article views including HTML views, PDF and ePub downloads, according to the available data) and Abstracts Views on Vision4Press platform.
Data correspond to usage on the plateform after 2015. The current usage metrics is available 48-96 hours after online publication and is updated daily on week days.
Initial download of the metrics may take a while.