Fig. 2
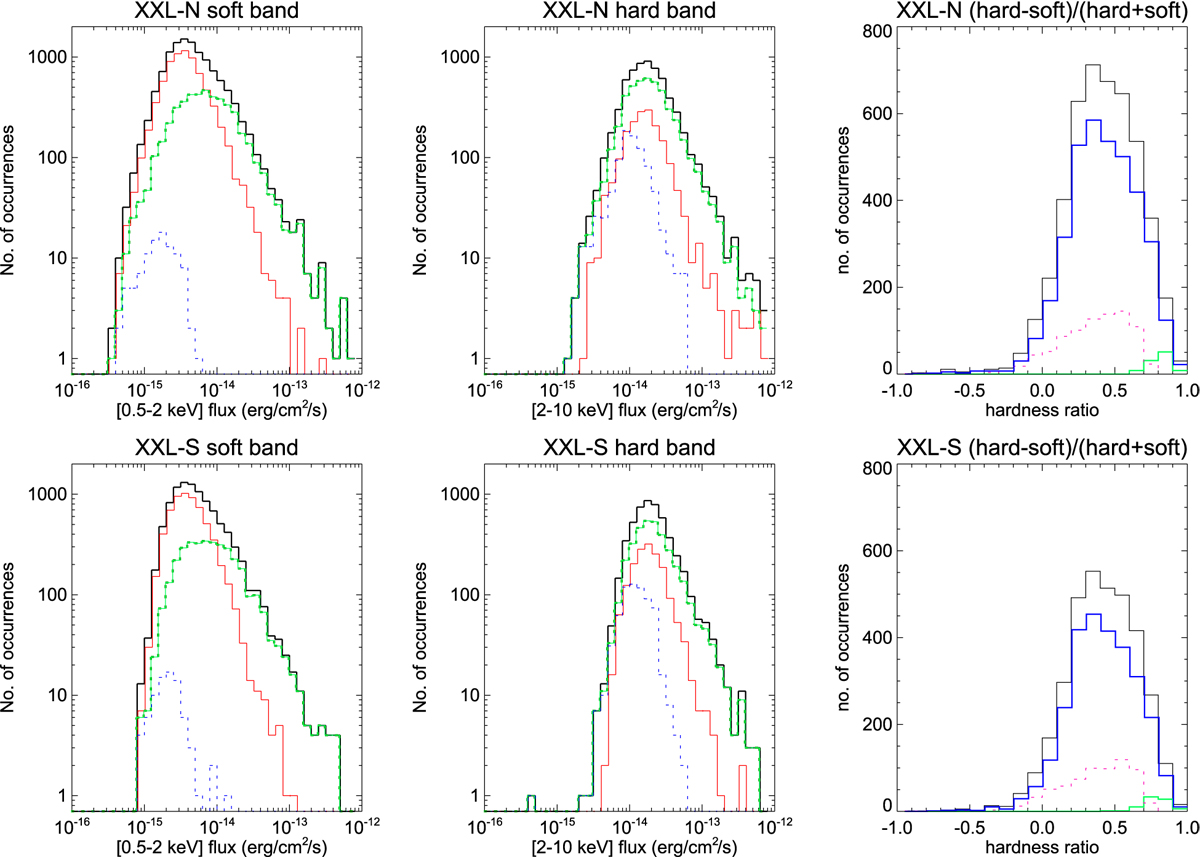
Distribution of the X-ray flux and hardness ratio (HR) for XXL-N (top panels) and XXL-S (bottom panels). The left column shows the soft band, the centre column the hard band, and the right column the flux hardness ratio (customarily defined as [hard − soft]/[hard + soft]), computed for sources detected in both bands. The black histograms in the four leftmost plots correspond to all sources detected in each band; the thin red histograms to sources detected only in one band (hence by definition not spurious in it); the green dashed histograms to sources also detected in the other band (the sum of the green and red histograms corresponds to the total); the subset of the sources detected in both bands but nominally spurious inthe band of relevance are shown by the dotted blue histogram. In the HR distribution, the thin black histogram corresponds to all sources detected in both bands under any condition, which in turn fall into the following three categories: the thick blue histogram represents sources that are non-spurious in both bands; the dashed magenta one represents those that are spurious in the hard band; and the tiny thick green one at the extreme right those that are spurious in the soft band. Some histograms are slightly displaced along the x-axis for clarity.
Current usage metrics show cumulative count of Article Views (full-text article views including HTML views, PDF and ePub downloads, according to the available data) and Abstracts Views on Vision4Press platform.
Data correspond to usage on the plateform after 2015. The current usage metrics is available 48-96 hours after online publication and is updated daily on week days.
Initial download of the metrics may take a while.