Fig. A.1
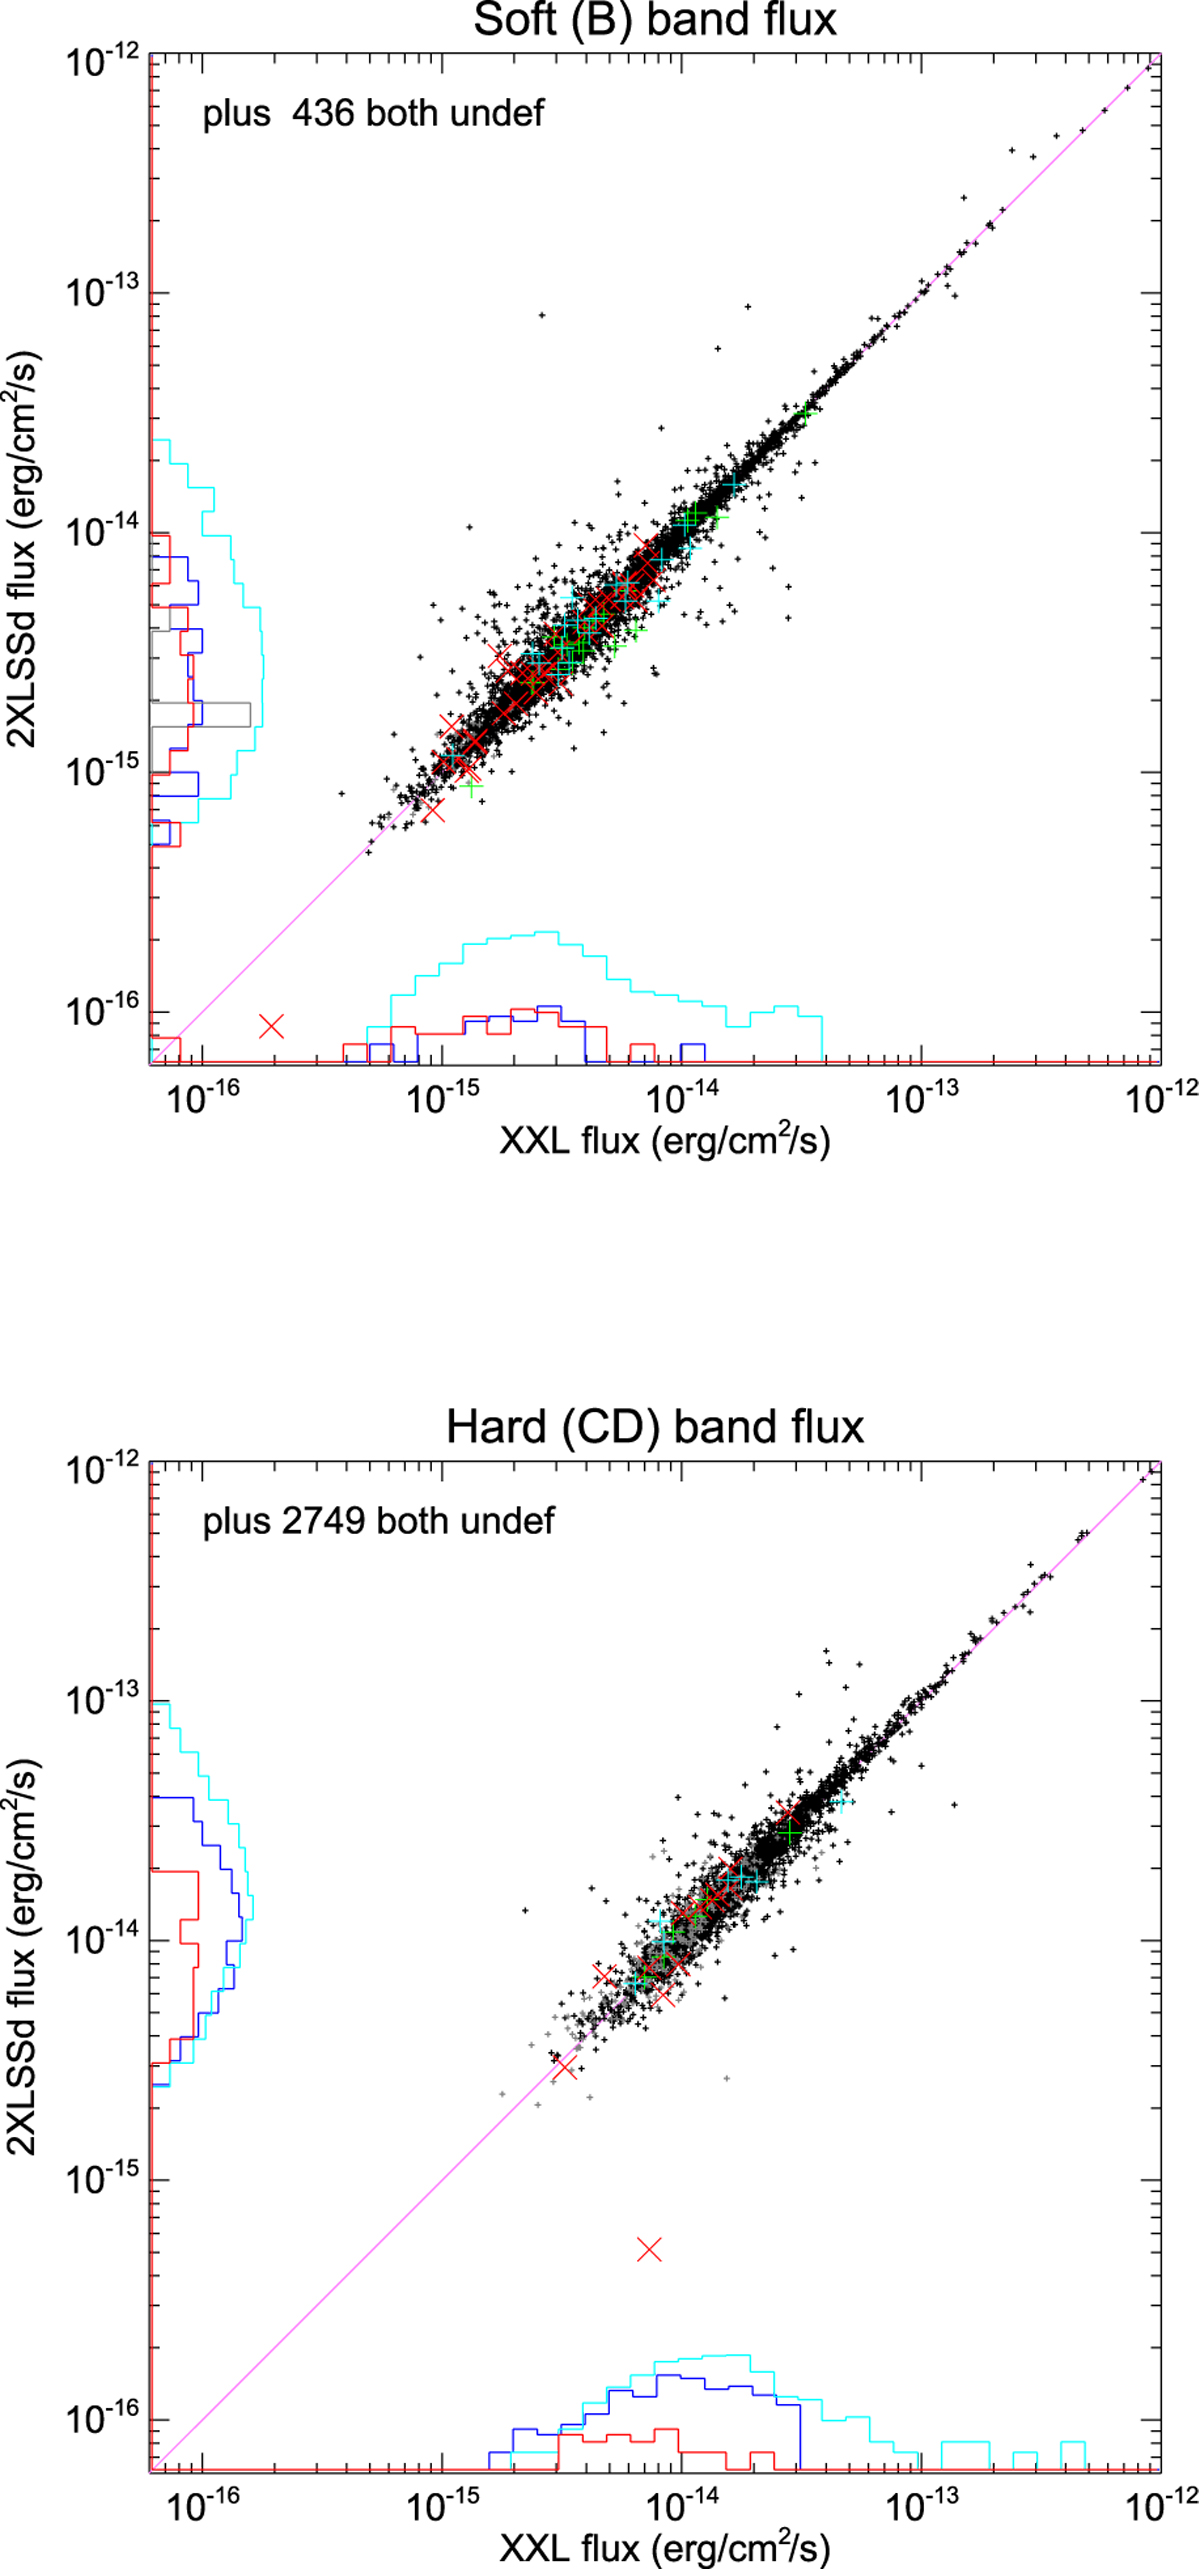
Comparison between XXL and 2XLSSd fluxes in the soft (upper panel) and hard (lower panel) bands. Symbols and colour-coding are as follows: small black crosses are sources classified as pointlike in both the new and old catalogues; thick red Xs are sources classified as extended in both catalogues; large green crosses are extended objects in the old catalogue and pointlike in the new one; cyan crosses are the reverse. The histograms (with arbitrary normalisations) indicate sources present in both catalogues but having undefined flux in the energy band of interest in one catalogue (blue); extended sources detected only in one catalogue (red); and pointlike sources detected only in one catalogue (cyan). The extended sources consider only the C2 case, since C1 objects by construction have fluxes set to undefined in the database. The number of sources not detected in the band of interest in both catalogues is annotated in the top left corner.
Current usage metrics show cumulative count of Article Views (full-text article views including HTML views, PDF and ePub downloads, according to the available data) and Abstracts Views on Vision4Press platform.
Data correspond to usage on the plateform after 2015. The current usage metrics is available 48-96 hours after online publication and is updated daily on week days.
Initial download of the metrics may take a while.