Fig. 1
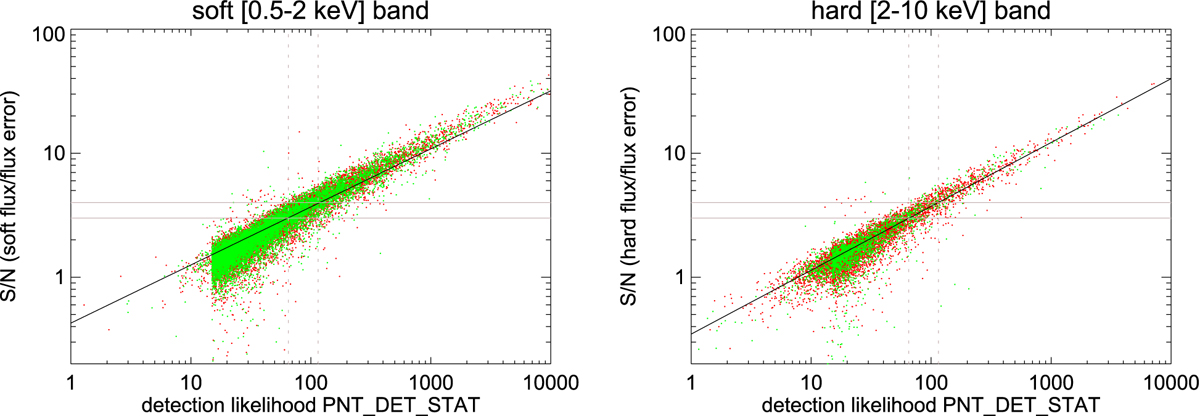
Cross-calibration of the S/N (flux divided by computed flux error) vs. the detection statistic PNT_DET_STAT for the soft (left) and hard (right) X-ray bands. The red and green dots correspond, respectively, to point-like sources in XXL-N and XXL-S. The solid thick line is a linear fit in log–log space to the S/N averaged in pseudo-logarithmic (the pseudo-logarithmic binning is a spacing of 1 in PNT_DET_STAT up to 100, then 5 up to 1000, 50 up to 10 000, and 500 above 10 000) likelihood bins. The two pale grey horizontal lines are fiducial marks for the 3σ and 4σ levels. The equivalent dotted vertical lines are for PNT_DET_STAT of 65 and 115.
Current usage metrics show cumulative count of Article Views (full-text article views including HTML views, PDF and ePub downloads, according to the available data) and Abstracts Views on Vision4Press platform.
Data correspond to usage on the plateform after 2015. The current usage metrics is available 48-96 hours after online publication and is updated daily on week days.
Initial download of the metrics may take a while.