Fig. 9
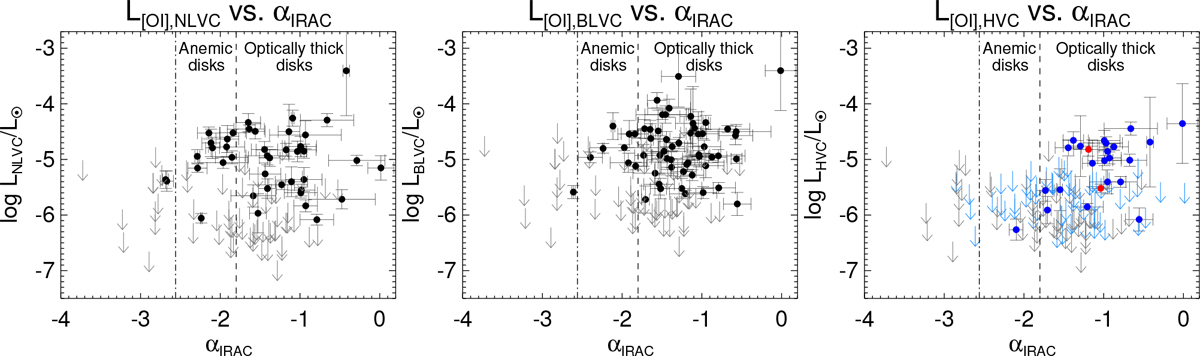
Luminosity of each [OI]λ6300 component versus the αIRAC index for all accreting systems. Gray arrows represent upper limits for [OI]λ6300 line luminosities when no emission in [OI]λ6300 was detected. In the HVC plot (right column): light blue arrows represent upper limits for HVC luminosities when only low-velocity [OI]λ6300 emission was detected; blue filled circles represent blueshifted HVCs while red filled circles represent redshifted HVCs (systems that did not present a blueshifted component). Dashed lines represent the boundary between systems with optically thick inner disks (right) and systems with anemic disks (middle), while dashed-dotted lines represent the boundary between systems with anemic disks and naked photospheres, according to αIRAC (left).
Current usage metrics show cumulative count of Article Views (full-text article views including HTML views, PDF and ePub downloads, according to the available data) and Abstracts Views on Vision4Press platform.
Data correspond to usage on the plateform after 2015. The current usage metrics is available 48-96 hours after online publication and is updated daily on week days.
Initial download of the metrics may take a while.