Fig. 8
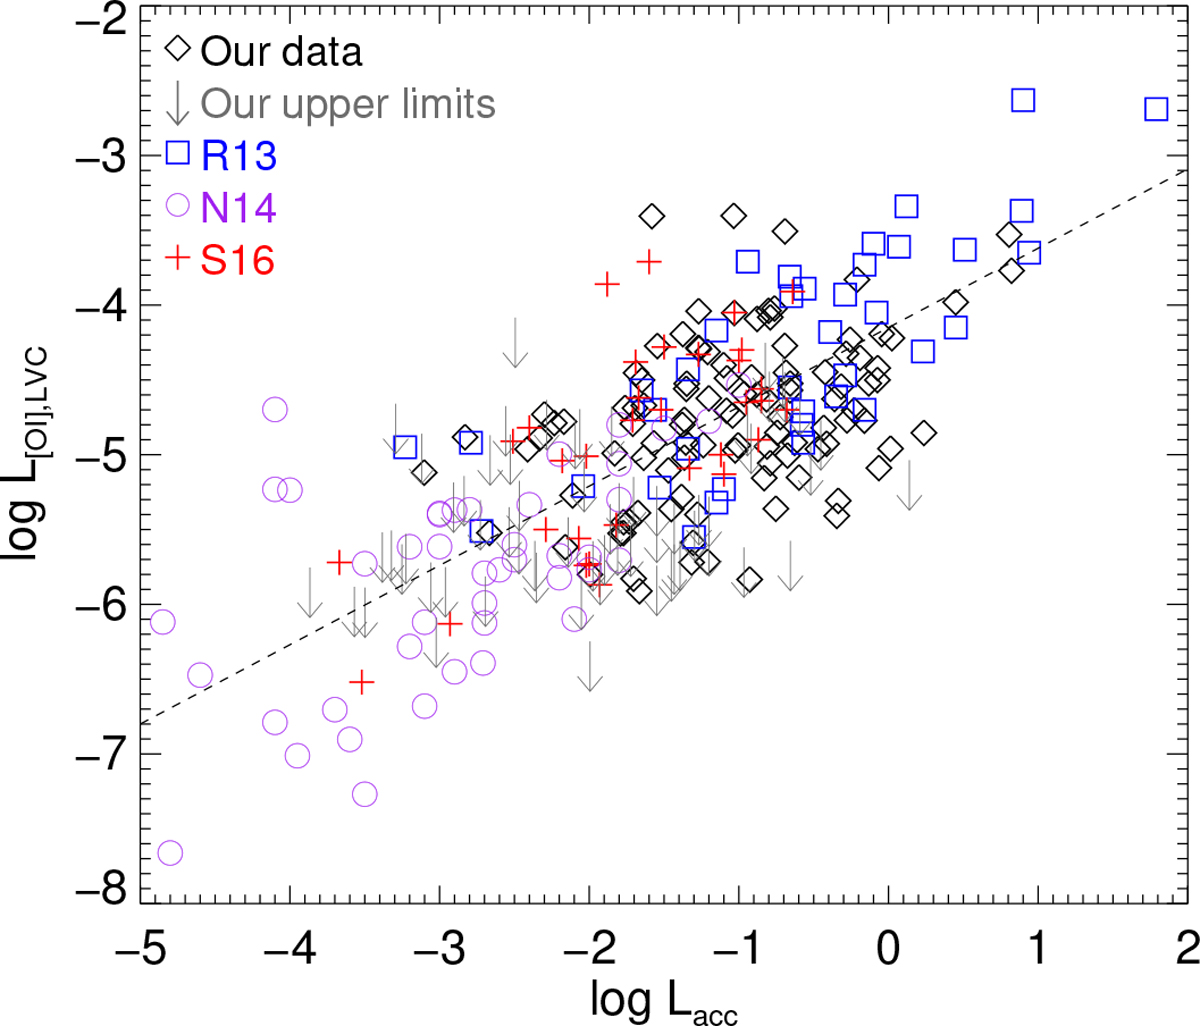
[OI]λ6300 LVC luminosity versus accretion luminosity. Black diamonds represent our detections, while gray arrows represent our 3σ upper limits to the LVC luminosities when no emission in [OI]λ6300 was detected. Blue squares, purple circles and red crosses represent the values given in R13, N14 and S16 for their samples, respectively. The dashed lines shows a linear fit to the combination of all four samples, including our upper limits.
Current usage metrics show cumulative count of Article Views (full-text article views including HTML views, PDF and ePub downloads, according to the available data) and Abstracts Views on Vision4Press platform.
Data correspond to usage on the plateform after 2015. The current usage metrics is available 48-96 hours after online publication and is updated daily on week days.
Initial download of the metrics may take a while.