Fig. 7
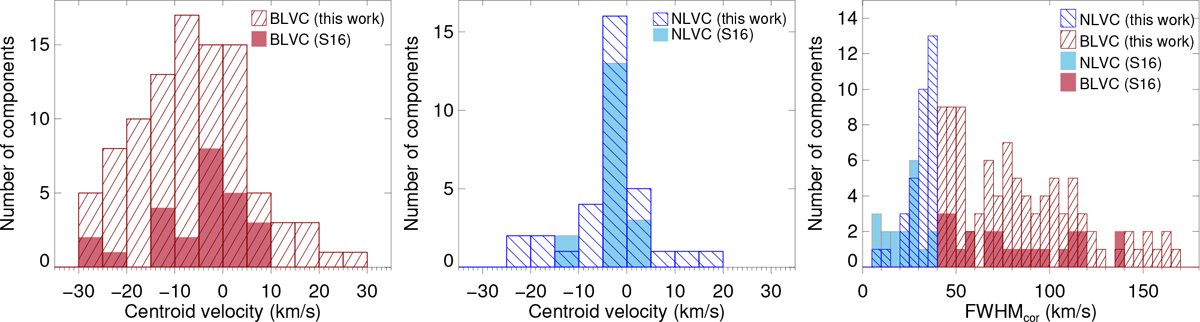
Comparison of the centroid velocities and FWHM of the low-velocity components of the [OI]λ6300 line in our sample and in S16. Striped red bins represent our broad LVCs, shaded red bins represent the BLVCs of S16, striped blue bins represent our narrow LVCs, and shaded blue bins represent the NLVCs of S16. For this figure, we use the definition of S16 to classify our components, in order to compare the two samples (i.e., BLVCs have |vc | < 30 km s−1 and FWHM > 40 km s−1 and NLVCs have |vc| < 30 km s−1 and FWHM ≤ 40 km s−1). Right panel: FWHM have been deconvolved from the instrumental profiles in both samples, in order to compare without the influence of the different spectral resolutions.
Current usage metrics show cumulative count of Article Views (full-text article views including HTML views, PDF and ePub downloads, according to the available data) and Abstracts Views on Vision4Press platform.
Data correspond to usage on the plateform after 2015. The current usage metrics is available 48-96 hours after online publication and is updated daily on week days.
Initial download of the metrics may take a while.