Fig. D.3
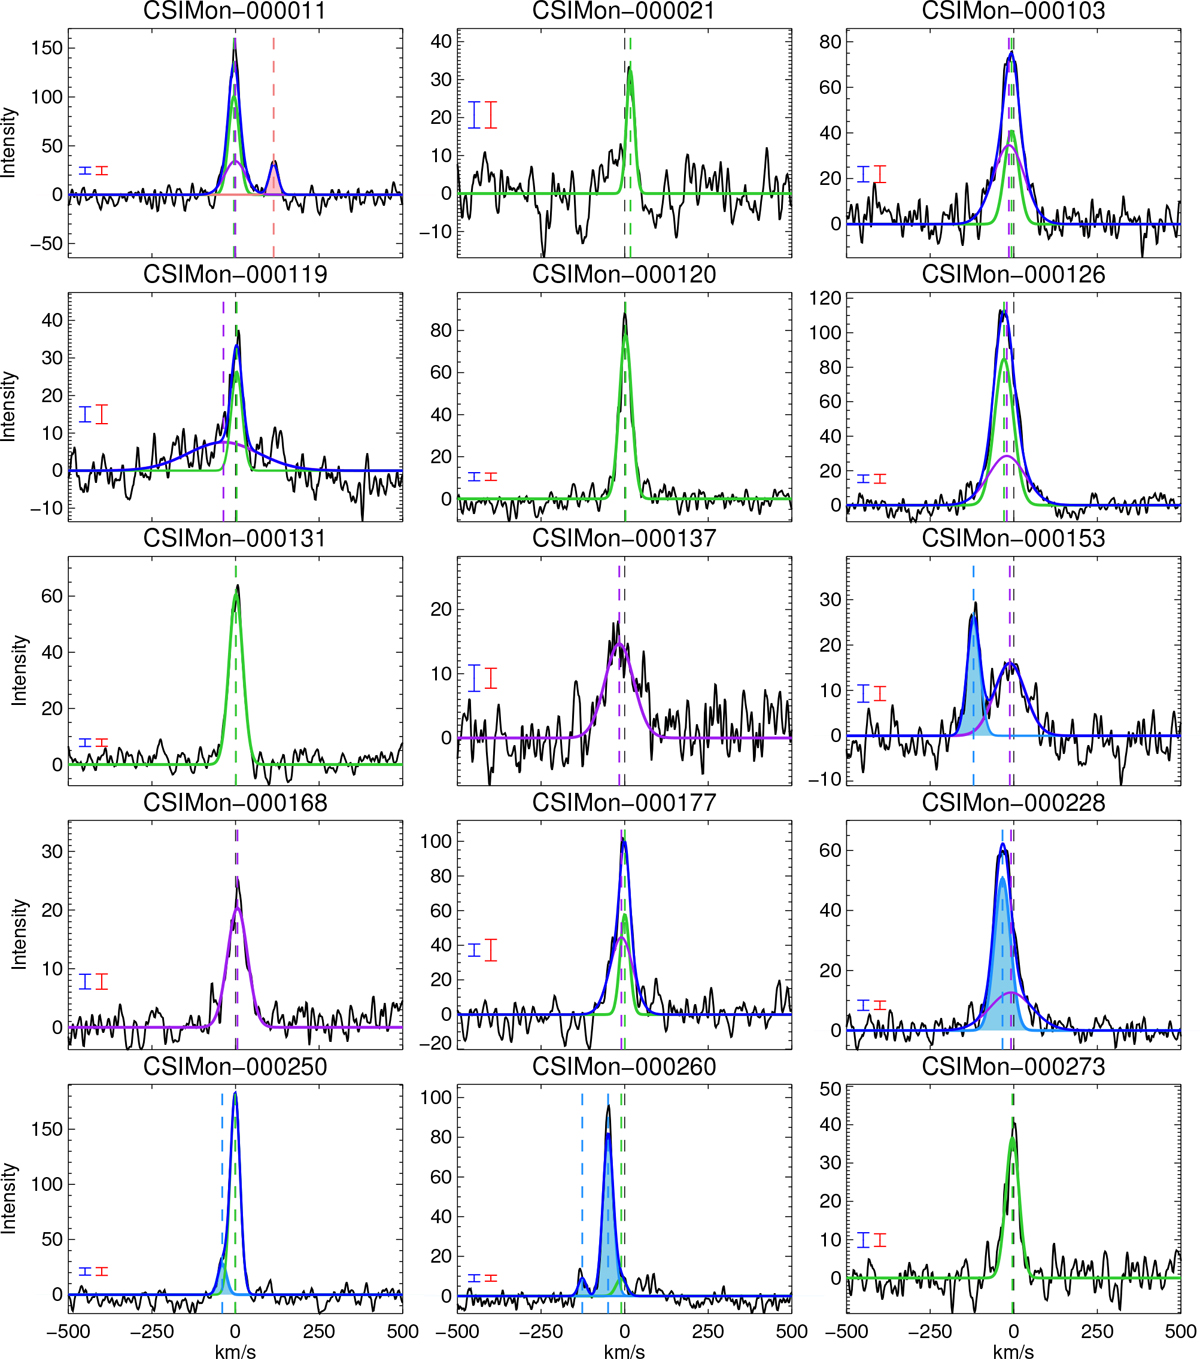
Gaussian decomposition of the [OI]λ6300 line profiles. Individual Gaussians are shown in different colors: in green are the narrow LVCs; in purple the broad LVCs; light blue shaded components represent blueshifted HVCs; and pink shaded components represent redshifted HVCs. The sum of all Gaussians is shown in blue. These are all plotted over the observed profile, which is in black. A red error bar in the bottom left corner of each panel shows the 1σ level of residue of the final spectrum (corrected for telluric and photospheric contribution), while the blue error bar shows the 1σ level of the noise in the continuum of the original, uncorrected spectrum.
Current usage metrics show cumulative count of Article Views (full-text article views including HTML views, PDF and ePub downloads, according to the available data) and Abstracts Views on Vision4Press platform.
Data correspond to usage on the plateform after 2015. The current usage metrics is available 48-96 hours after online publication and is updated daily on week days.
Initial download of the metrics may take a while.