Fig. 4
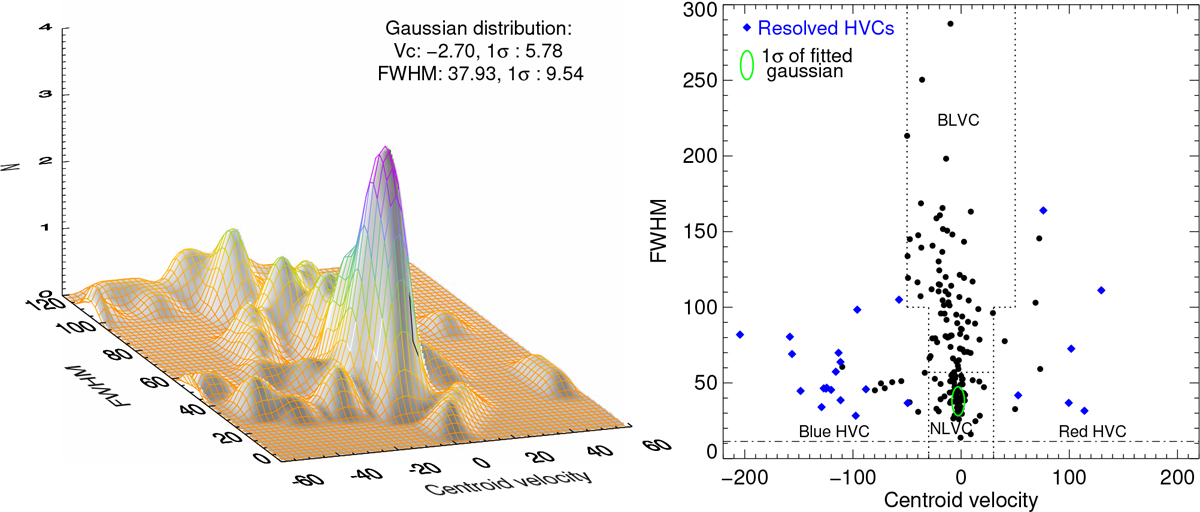
Right panel: distribution of FWHM and centroid velocity of all components from all profiles derived from the Gaussian fits. Dotted lines indicate the separation between different components – narrow and broad LVC, red and blueshifted HVC, according to our analysis (though there is some overlap between the NLVC and BLVC). The dashed-dotted line represents our instrumental profile, below which no components are found. Blue diamonds represent high-velocity components whose peaks are resolved, and not blended with the low-velocity emission. Left panel: surface plot of the central region of the distribution shown in the right panel, where the z axis represents the number of Gaussian components in square bins of 5 km s−1 × 5 km s−1. The primary peak corresponds to the locus of the narrow LVC, while the secondary peak represents a concentration of broad LVCs.
Current usage metrics show cumulative count of Article Views (full-text article views including HTML views, PDF and ePub downloads, according to the available data) and Abstracts Views on Vision4Press platform.
Data correspond to usage on the plateform after 2015. The current usage metrics is available 48-96 hours after online publication and is updated daily on week days.
Initial download of the metrics may take a while.