Fig. 3
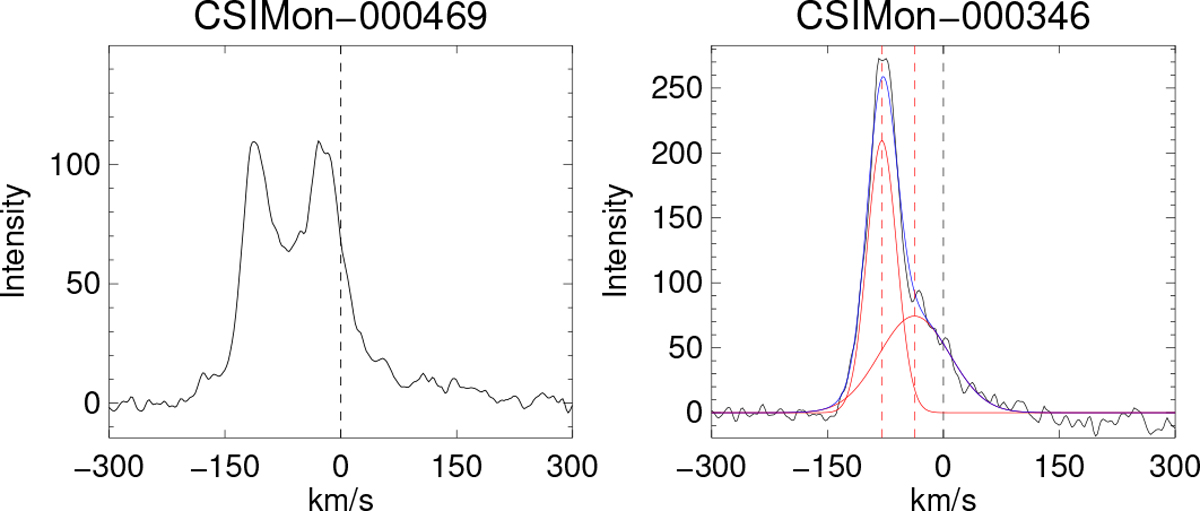
Two examples of [OI]λ6300 emission line profiles found in our sample. Left panel: two distinct peaks can be identified, one close to the stellar rest velocity and the other blueshifted by over 100 km s−1. Right panel:Gaussian decomposition of a very asymmetric profile. Two separate Gaussians are shown in red, while the sum of the two is shown in blue, overplotted onto the observed profile (black).
Current usage metrics show cumulative count of Article Views (full-text article views including HTML views, PDF and ePub downloads, according to the available data) and Abstracts Views on Vision4Press platform.
Data correspond to usage on the plateform after 2015. The current usage metrics is available 48-96 hours after online publication and is updated daily on week days.
Initial download of the metrics may take a while.