Fig. A.2
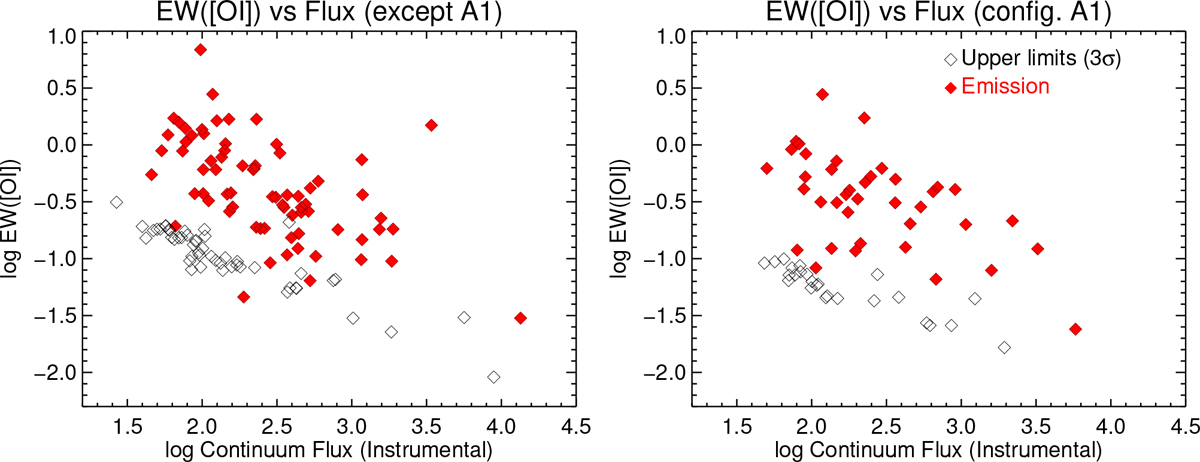
Equivalent width of the [OI]λ6300 line versus the instrumental flux of the continuum at 6300Å. Detections are shown as red filled diamonds, while upper limits of nondetections (taken as 3σ times the average FWHM of detections in our sample) are shown as black open diamonds. Right panel: A1 configuration, which was observed four times and has better S/N, left panel: all other configurations.
Current usage metrics show cumulative count of Article Views (full-text article views including HTML views, PDF and ePub downloads, according to the available data) and Abstracts Views on Vision4Press platform.
Data correspond to usage on the plateform after 2015. The current usage metrics is available 48-96 hours after online publication and is updated daily on week days.
Initial download of the metrics may take a while.