Open Access
Fig. A.1
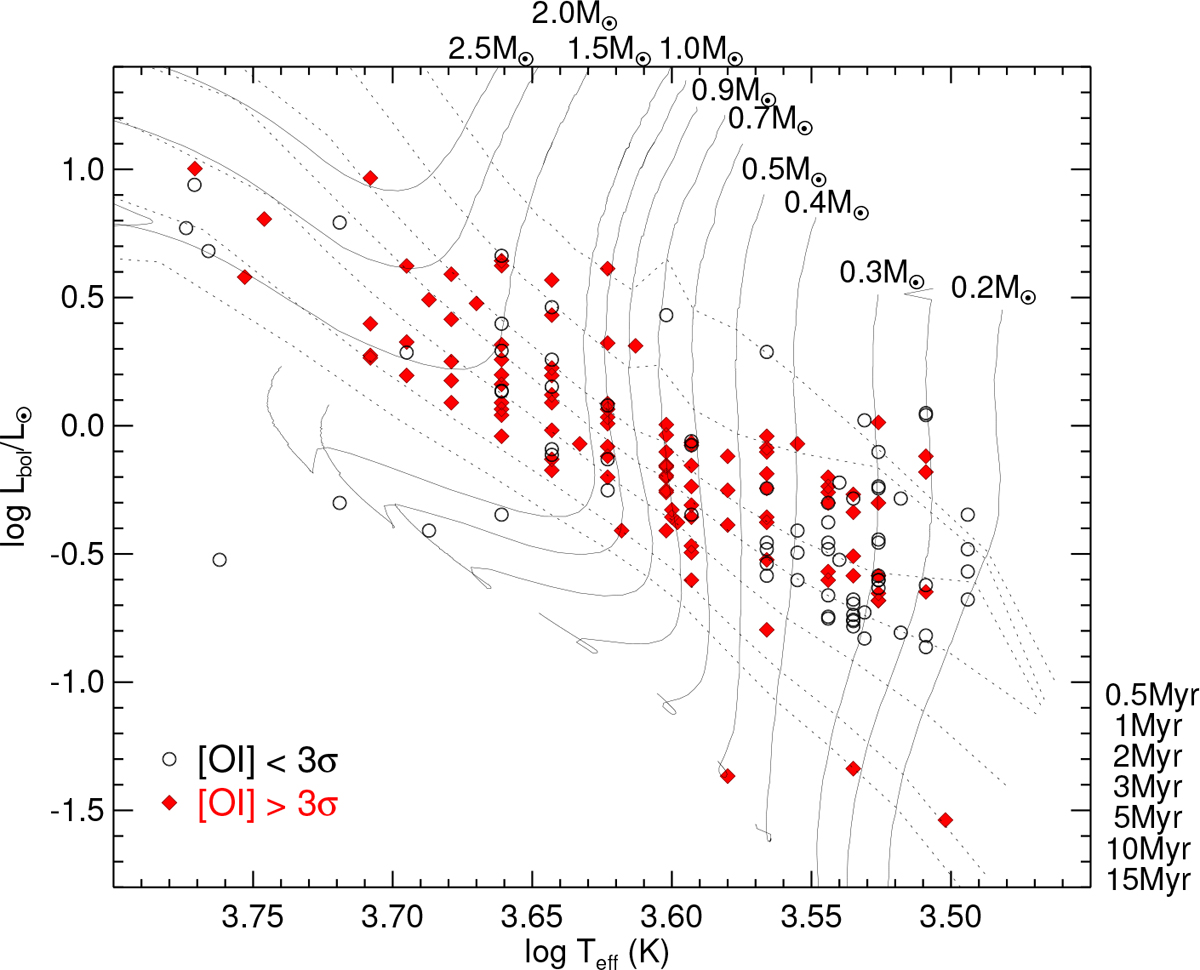
HR Diagram of the CTTSs in our sample that have detected [OI]λ6300 emission (red filled diamonds) and that do not (black open circles). Mass tracks and isochrones of Siess et al. (2000) are shown as solid and dashed lines, respectively.
Current usage metrics show cumulative count of Article Views (full-text article views including HTML views, PDF and ePub downloads, according to the available data) and Abstracts Views on Vision4Press platform.
Data correspond to usage on the plateform after 2015. The current usage metrics is available 48-96 hours after online publication and is updated daily on week days.
Initial download of the metrics may take a while.