Fig. 2
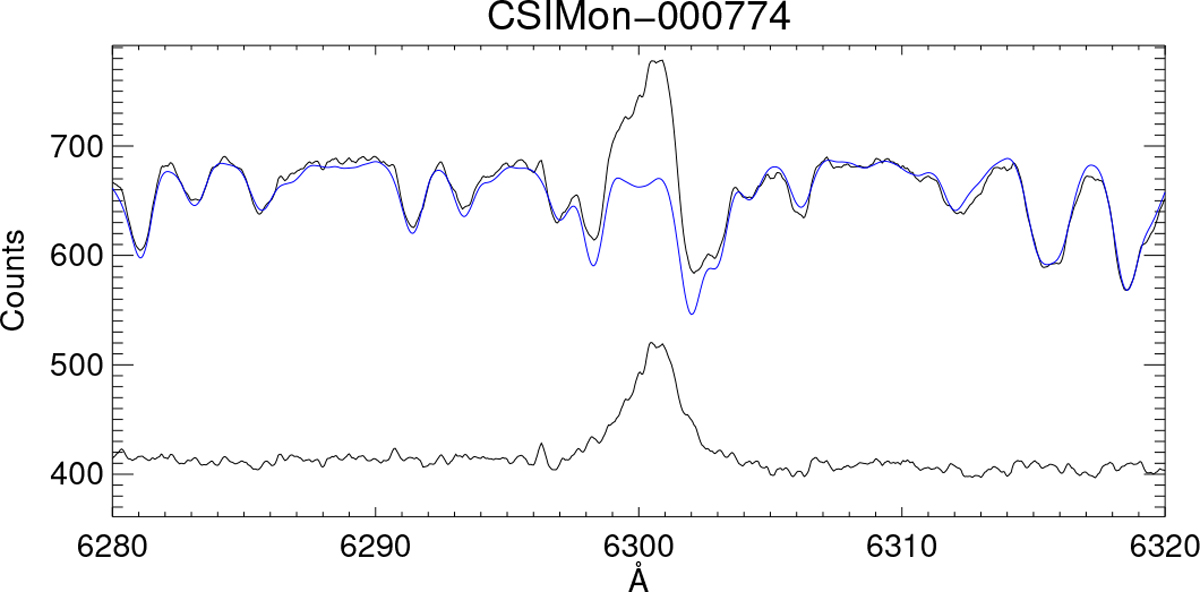
Example showing the photospheric contribution being removed from a CTTS spectrum in order to recover the intrinsic [OI]λ6300 emission line profile. The veiled, broadened WTTS template is shown in blue, plotted over the CTTS spectrum in black. Below, the final product is shown, shifted vertically to facilitate a comparison with the original spectrum. We can see that the wings of this profile are recovered after removing the photospheric absorption lines.
Current usage metrics show cumulative count of Article Views (full-text article views including HTML views, PDF and ePub downloads, according to the available data) and Abstracts Views on Vision4Press platform.
Data correspond to usage on the plateform after 2015. The current usage metrics is available 48-96 hours after online publication and is updated daily on week days.
Initial download of the metrics may take a while.