Fig. 19
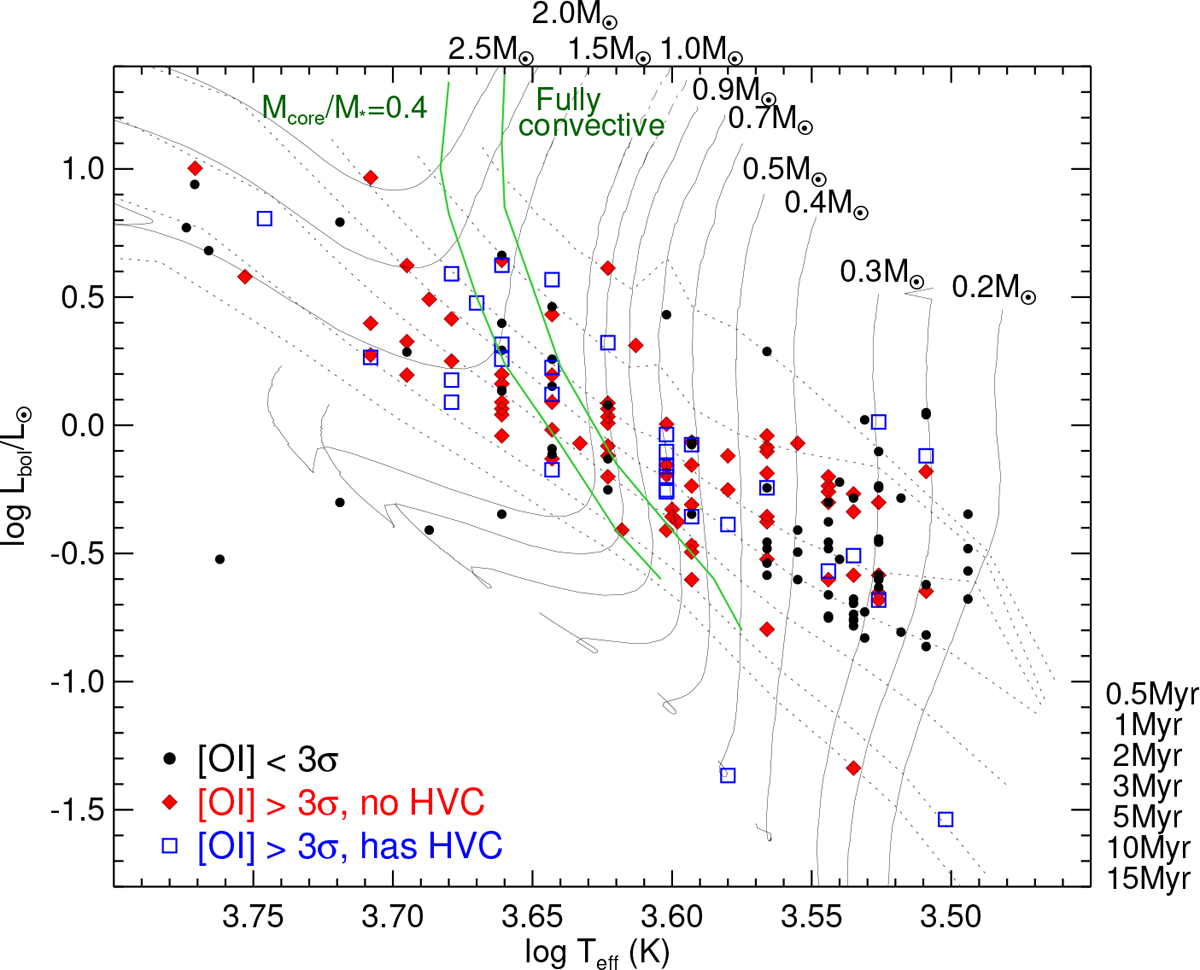
HR diagram of the CTTSs in our sample where no emission was detected (black dots), those with detected [OI]λ6300 emission but no HVC (red diamonds), and those with a HVC (blue squares). Solid and dotted black lines represent mass tracks and isochrones, respectively, of Siess et al. (2000). Solid green lines separate the regions in which a star is expected to be fully convective (right) and possess a radiative core of Mcore > 0.4 M* (left), according to Gregory et al. (2012).
Current usage metrics show cumulative count of Article Views (full-text article views including HTML views, PDF and ePub downloads, according to the available data) and Abstracts Views on Vision4Press platform.
Data correspond to usage on the plateform after 2015. The current usage metrics is available 48-96 hours after online publication and is updated daily on week days.
Initial download of the metrics may take a while.