Fig. 17
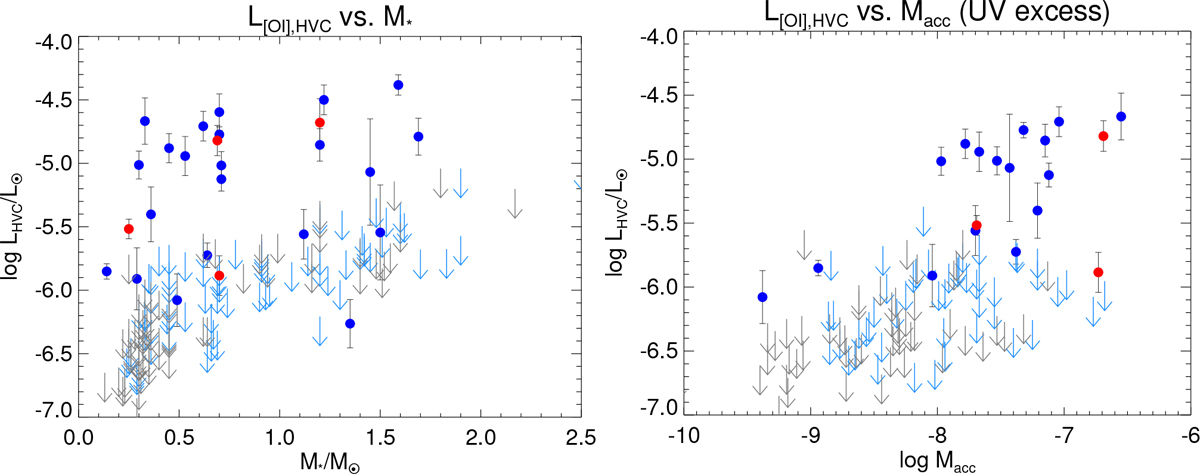
[OI]λ6300 HVC luminosity versus stellar mass (left panel) and mass accretion rate derived from the UV excess (right panel). Gray arrows represent upper limits for [OI]λ6300 line luminosities when no emission in [OI]λ6300 was detected, while light blue arrows represent upper limits for HVC luminosities when only low-velocity [OI]λ6300 emission was detected. Blue filled circles represent blueshifted HVCs, while red filled circles represent redshifted HVCs (systems that did not present a blueshifted component). Luminosities of redshifted HVCs should be considered as lower limits, since the redshifted part of the jet suffers additional extinction from the circumstellar disk.
Current usage metrics show cumulative count of Article Views (full-text article views including HTML views, PDF and ePub downloads, according to the available data) and Abstracts Views on Vision4Press platform.
Data correspond to usage on the plateform after 2015. The current usage metrics is available 48-96 hours after online publication and is updated daily on week days.
Initial download of the metrics may take a while.