Fig. 15
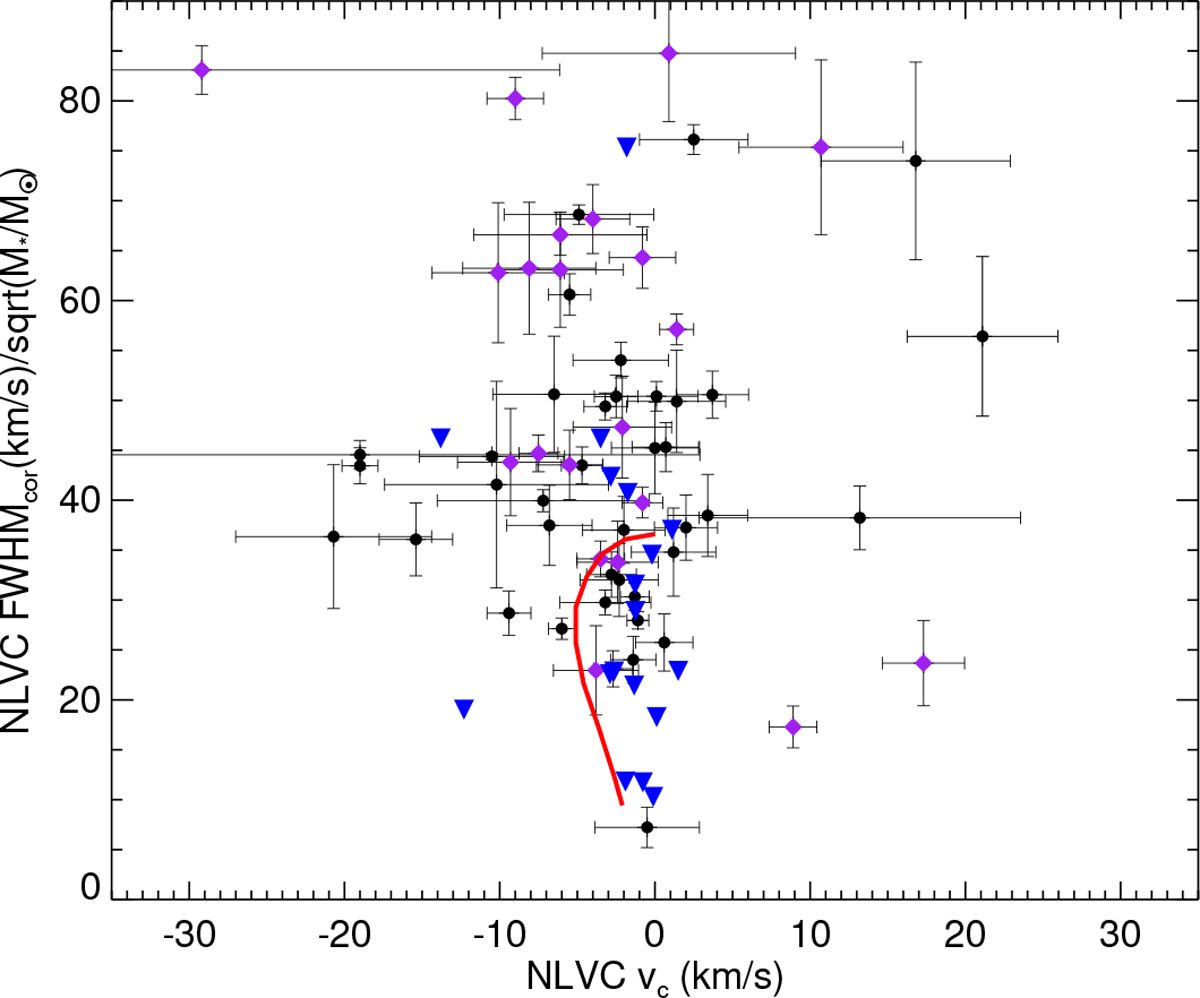
Distribution of FWHM![]() versus centroid velocities for the narrow LVCs in our sample (black dots) and in S16 (blue triangle), compared with theoretical expectations from Ercolano & Owen (2016) for a star of M* = 0.7M⊙, LX = 2× 1030 erg/s, and Lacc = Lbol, varying the system inclination from i = 0° to i = 90° (thick red line). Purple diamonds represent systems observed at high inclinations, therefore there could be misclassification of the components in their [OI]λ6300 line profile due to projection effects.
versus centroid velocities for the narrow LVCs in our sample (black dots) and in S16 (blue triangle), compared with theoretical expectations from Ercolano & Owen (2016) for a star of M* = 0.7M⊙, LX = 2× 1030 erg/s, and Lacc = Lbol, varying the system inclination from i = 0° to i = 90° (thick red line). Purple diamonds represent systems observed at high inclinations, therefore there could be misclassification of the components in their [OI]λ6300 line profile due to projection effects.
Current usage metrics show cumulative count of Article Views (full-text article views including HTML views, PDF and ePub downloads, according to the available data) and Abstracts Views on Vision4Press platform.
Data correspond to usage on the plateform after 2015. The current usage metrics is available 48-96 hours after online publication and is updated daily on week days.
Initial download of the metrics may take a while.