Fig. 13
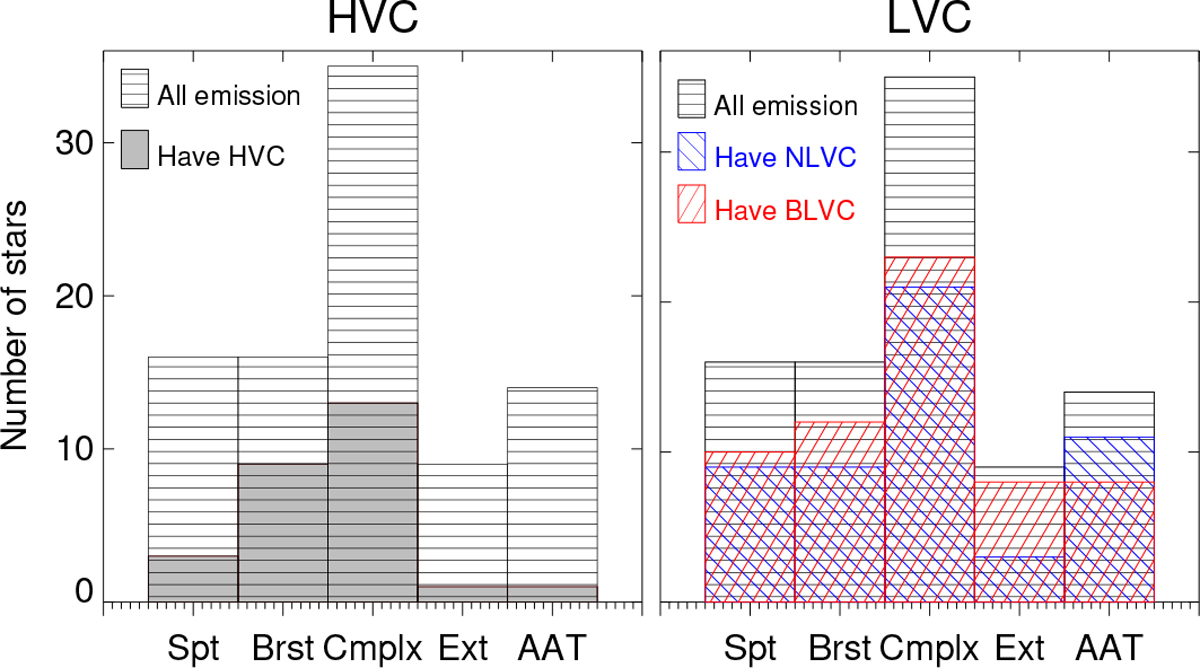
Histogram of light curve types for the systems where [OI]λ6300 emission was detected (black striped bins), for those that present a HVC (left panel, shaded gray bins), for those that present a NLVC (right panel, blue), and for those that present a BLVC (right panel, red). The ordinate represents the number of systems that present each light curve type. From left to right, the bins represent systems with spot-like light curves in one or both CoRoT runs; systems with accretion burst-dominated light curves in both CoRoT runs; systems with complex light curves in both CoRoT runs; systems with aperiodic extinction-dominated light curves in both CoRoT runs; and systems that showed an AA Tau-like light curve in one or both CoRoT runs.
Current usage metrics show cumulative count of Article Views (full-text article views including HTML views, PDF and ePub downloads, according to the available data) and Abstracts Views on Vision4Press platform.
Data correspond to usage on the plateform after 2015. The current usage metrics is available 48-96 hours after online publication and is updated daily on week days.
Initial download of the metrics may take a while.