Fig. 12
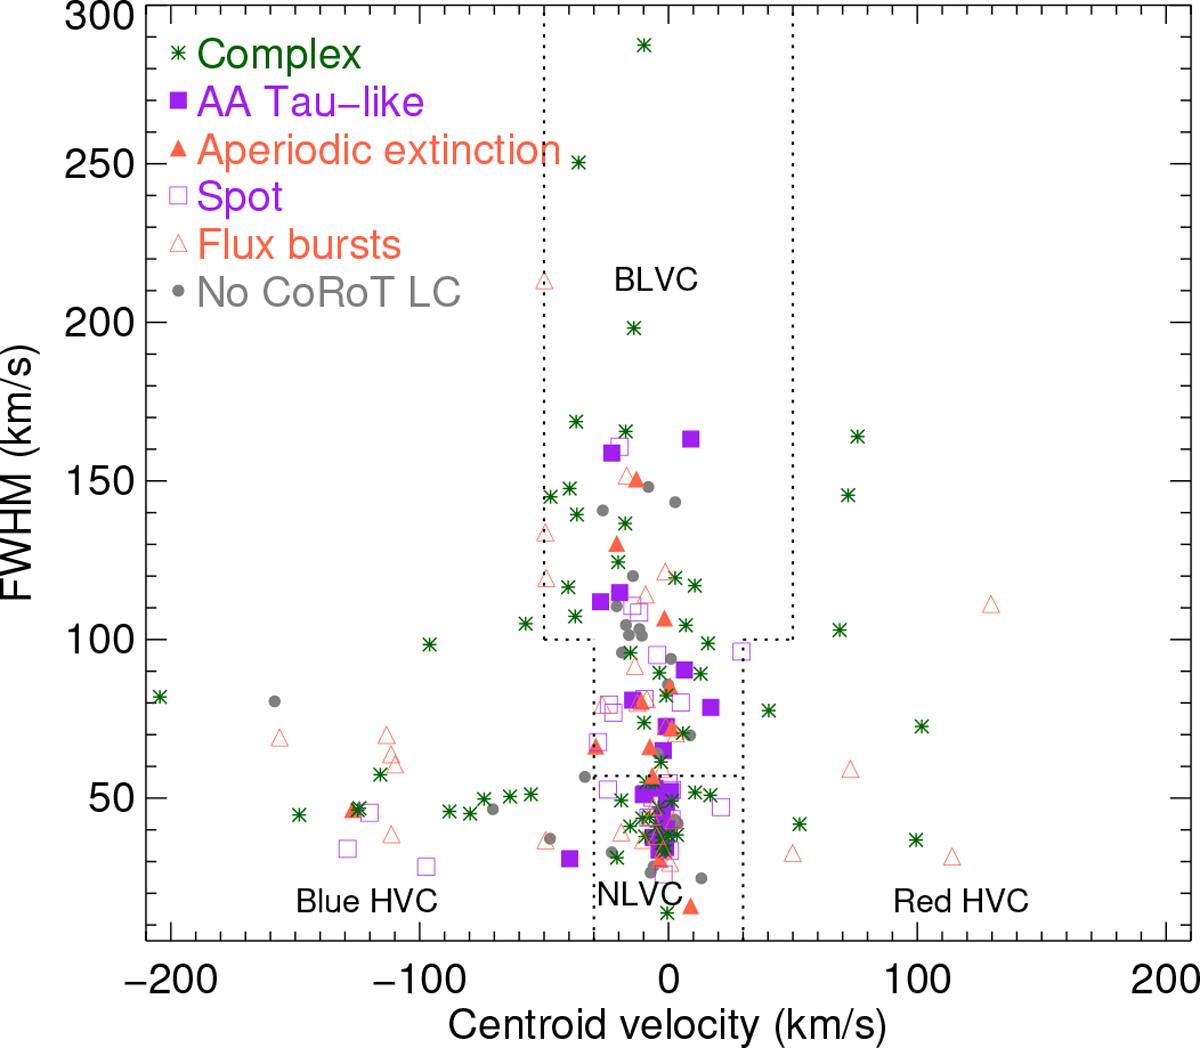
Distribution of centroid velocities and FWHM of all components in our sample, with different colors and symbols representingdifferent types of photometric variability. Purple symbols represent systems that showed a periodic behavior in one or both CoRoT observing runs, with filled squares corresponding to AA Tau-like systems and open squares to those with spot-like behavior. Orange symbols represent systems that were nonperiodic in both 2008 and 2011, with filled triangles corresponding to systems whose light curves are dominated by aperiodic extinction and open triangles to those dominated by flux bursts. Green asterisks represent light curves that were classified as complex. Dashed lines indicate approximately the separation between different components – narrow and broad LVC, red- and blueshifted HVC.
Current usage metrics show cumulative count of Article Views (full-text article views including HTML views, PDF and ePub downloads, according to the available data) and Abstracts Views on Vision4Press platform.
Data correspond to usage on the plateform after 2015. The current usage metrics is available 48-96 hours after online publication and is updated daily on week days.
Initial download of the metrics may take a while.