Fig. 11
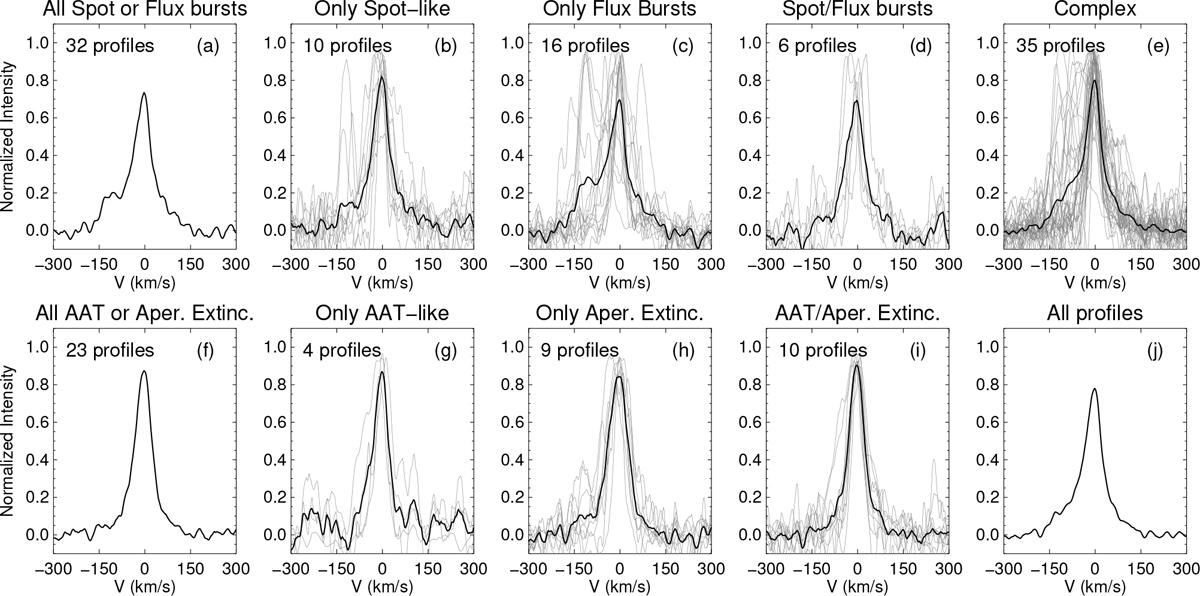
[OI]λ6300 line profiles for different types of photometric variability. Profiles of individual stars are shown in gray while the average in each group is shown in a thick black. From left to right, top to bottom: (panel a) stars that presented either spot-like or flux burst-dominated light curves in either CoRoT observation (likely observed at medium to low inclinations); (panel b) stars with spot-like light curves in both CoRoT observations; (panel c) stars with light curves dominated by stochastic flux bursts in both CoRoT observations; (panel d) stars that altered between spot-like and flux bursts between 2008 and 2011; (panel e) stars with complex (difficult to classify) light curves; (panel f) stars that presented either AA Tau-like or aperiodic extinction-dominated light curves in either CoRoT observation (likely observed at high inclinations); (panel g) stars that presented only AA Tau-like light curves in both CoRoT observations; (panel h) stars that presented only aperiodic extinction-dominated light curves in both CoRoT observations; (panel i) stars that alternated between AA Tau-like and aperiodic extinction between 2008 and 2011; and finally (panel j) an average of all [OI]λ6300 line profiles. Each profile was normalized by its maximum intensity before the average was taken.
Current usage metrics show cumulative count of Article Views (full-text article views including HTML views, PDF and ePub downloads, according to the available data) and Abstracts Views on Vision4Press platform.
Data correspond to usage on the plateform after 2015. The current usage metrics is available 48-96 hours after online publication and is updated daily on week days.
Initial download of the metrics may take a while.