Fig. 1
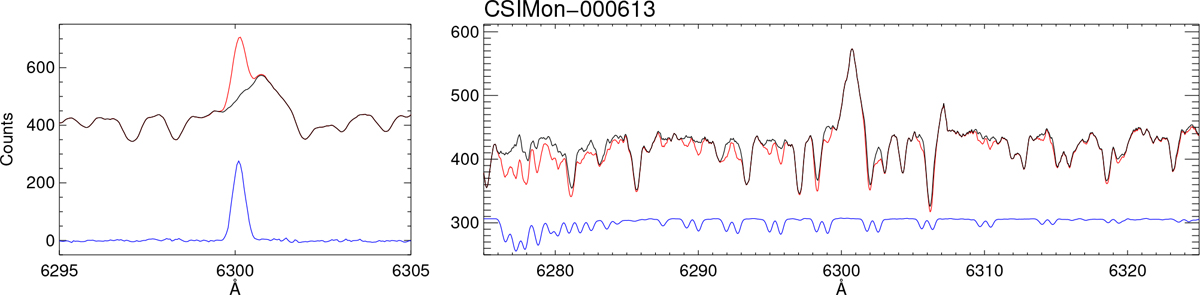
Example of the process to remove telluric emission and absorption lines from the stellar spectra. Left panel: the original spectrum is shown in red; the isolated contamination, taken as the average of 3 sky spectra that were observed simultaneously with the stellar spectrum, is shown below in blue; and the result after subtraction is overplotted in black. Right panel: the spectrum, now with the telluric emission line removed, is shown in red; the telluric absorption line template, scaled and shifted vertically to facilitate a comparison with the stellar spectrum, is shown below in blue; and the final decontaminated spectrum is overplotted in black.
Current usage metrics show cumulative count of Article Views (full-text article views including HTML views, PDF and ePub downloads, according to the available data) and Abstracts Views on Vision4Press platform.
Data correspond to usage on the plateform after 2015. The current usage metrics is available 48-96 hours after online publication and is updated daily on week days.
Initial download of the metrics may take a while.