Fig. 8
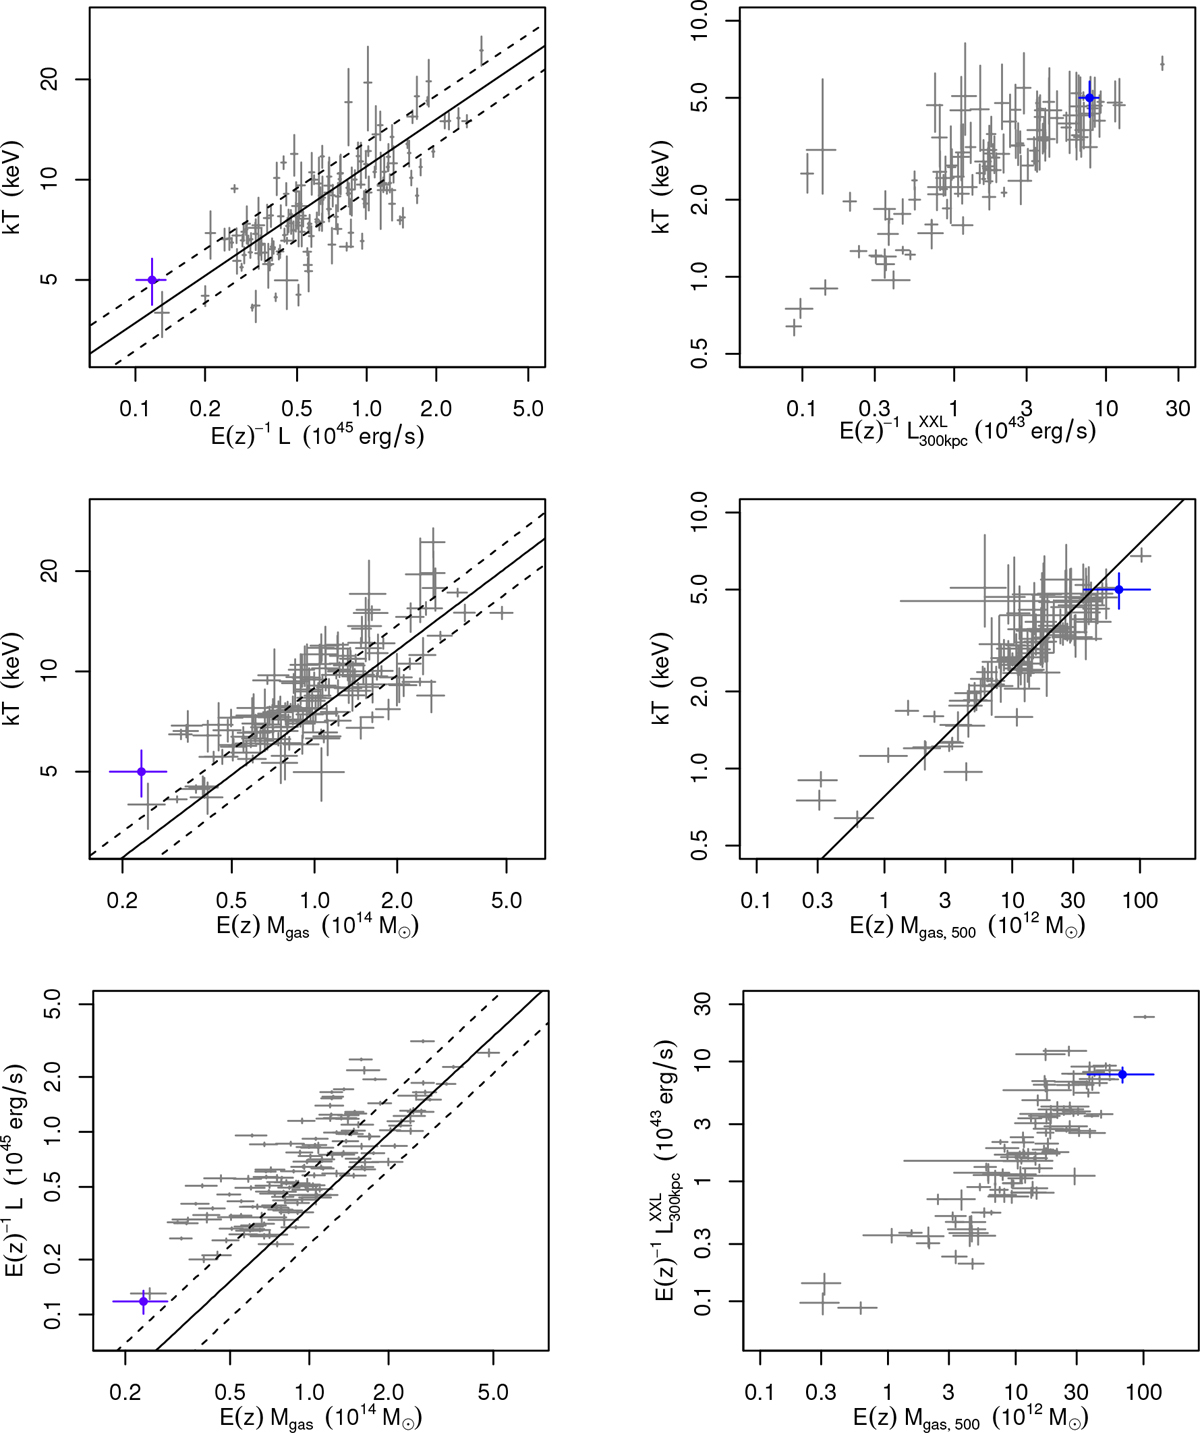
Comparison of the global properties of XLSSC 122 (blue point) with lower-z, X-ray selected cluster samples. Factors of E(z) = H(z)∕H0 encode self-similar evolution of the scaling relations. Left column: gray points show measurements from Mantz et al. (2016b, z < 0.5), and solid/dashed lines the corresponding scaling relations (accounting for X-ray flux-selection bias) and their uncertainty (including intrinsic scatter). These measurements were obtained from Chandra data, but otherwise the procedure for determining each observable (and r500) is essentially the identical to the one used in this work. Luminosities correspond to the rest-frame 0.1–2.4 keV band. Temperatures from Mantz et al. (2016b) are centre-excised (excluding radii < 0.15 r500), while the measurement for XLSSC 122 is not. Right column: gray points show measurements of the 100 brightest XXL clusters (z < 1.05; XXL Papers II, III and XIII). Luminosities correspond to the rest-frame 0.5–2.0 keV band, and luminosities and temperatures are measured in an aperture of radius 300 kpc. Gas masses are measured within r500, as estimated from the mass-temperature relation of XXL Paper IV. In the centre-right panel, solid line shows the Mgas –T relation of XXL Paper XIII.
Current usage metrics show cumulative count of Article Views (full-text article views including HTML views, PDF and ePub downloads, according to the available data) and Abstracts Views on Vision4Press platform.
Data correspond to usage on the plateform after 2015. The current usage metrics is available 48-96 hours after online publication and is updated daily on week days.
Initial download of the metrics may take a while.