Fig. 6
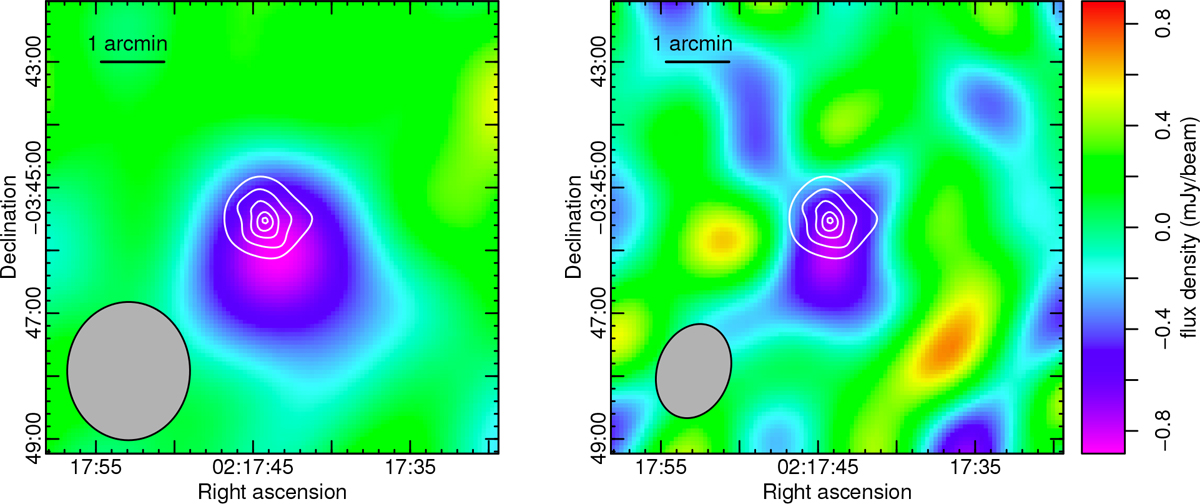
Short-baseline (uv radii < 2kλ) 30 GHz maps of XLSSC 122 from the CARMA-8 (left) and CARMA-23 (WB, right) data, after modeling and subtracting point sources and applying the CLEAN image reconstruction algorithm (Högbom 1974). White contours show the extended X-ray emission, as in Fig. 2. Gray ellipses in the lower-left corners show the synthesised beam shapes. Both maps use a common color table.
Current usage metrics show cumulative count of Article Views (full-text article views including HTML views, PDF and ePub downloads, according to the available data) and Abstracts Views on Vision4Press platform.
Data correspond to usage on the plateform after 2015. The current usage metrics is available 48-96 hours after online publication and is updated daily on week days.
Initial download of the metrics may take a while.