Fig. 5
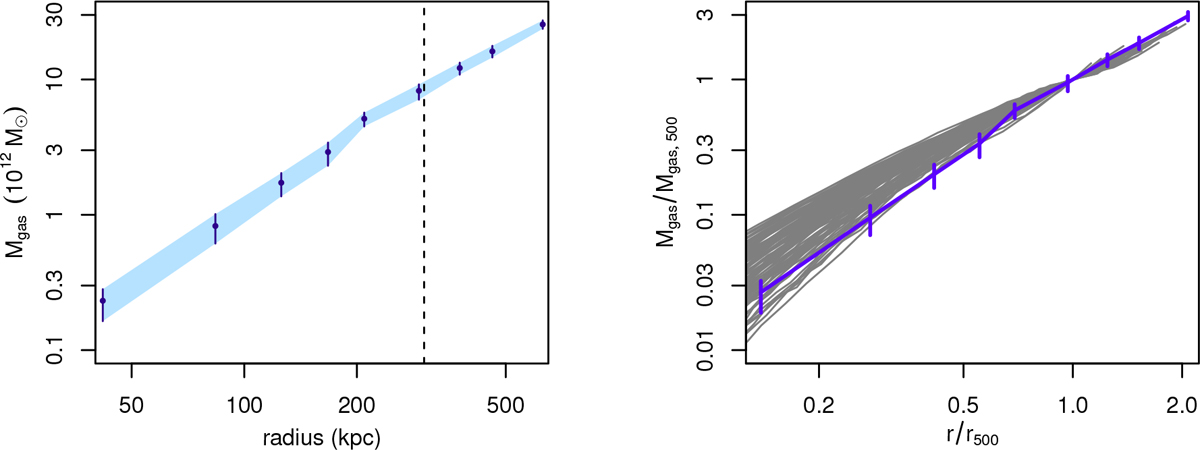
Left: gas mass profile of XLSSC 122 as determined from our analysis. Error bars and shading indicate the 68.3 per cent confidence region. The vertical, dashed line shows our estimate of r500, determined in Sect. 3.7. Right: the same gas mass profile in scaled units (blue) is compared with an ensemble of scaled profiles for massive, z < 0.5 clusters from Mantz et al. (2016b).
Current usage metrics show cumulative count of Article Views (full-text article views including HTML views, PDF and ePub downloads, according to the available data) and Abstracts Views on Vision4Press platform.
Data correspond to usage on the plateform after 2015. The current usage metrics is available 48-96 hours after online publication and is updated daily on week days.
Initial download of the metrics may take a while.