Fig. 4
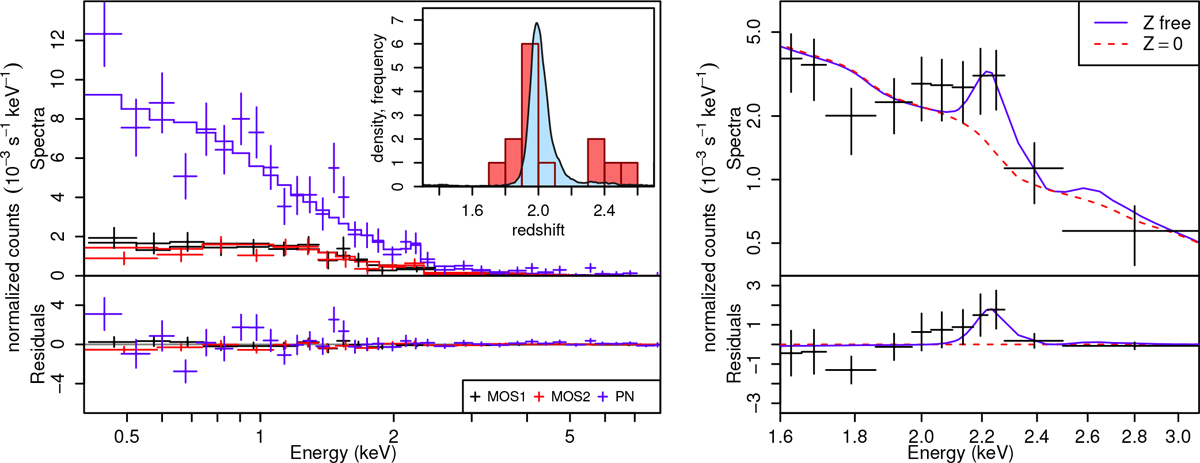
Left: background-subtracted spectra from each EPIC detector extracted from a circle of radius 35″ centred on the BCG. Solid lines show the best fitting folded model, consisting of a redshifted thermal emission spectrum with Galactic absorption (temperature, metallicity, redshift and normalisation are all free here). The inset shows the posterior distribution of the cluster redshift from this fit (blue shading), compared with the photometric redshift histogram for galaxies within 30″ of the X-ray centre from Willis et al. (2013; the full photo-z histogram includes projections at lower and higher redshifts; we show only the vicinity of the X-ray constraint here). The X-ray redshift constraint is possible due to the detection of the rest-frame 6.7 keV Fe emission line complex at a redshifted energy of ~ 2.2 keV. Right: the combined EPIC spectrum is compared with the best-fitting model (solid, blue curve) in the vicinity of the Fe emission complex. The dashed, red curve shows the same model with zero metallicity. Residuals are relative to the Z = 0 model. The Fe emission feature is formally detected at 2.6σ significance.
Current usage metrics show cumulative count of Article Views (full-text article views including HTML views, PDF and ePub downloads, according to the available data) and Abstracts Views on Vision4Press platform.
Data correspond to usage on the plateform after 2015. The current usage metrics is available 48-96 hours after online publication and is updated daily on week days.
Initial download of the metrics may take a while.