Fig. 3.
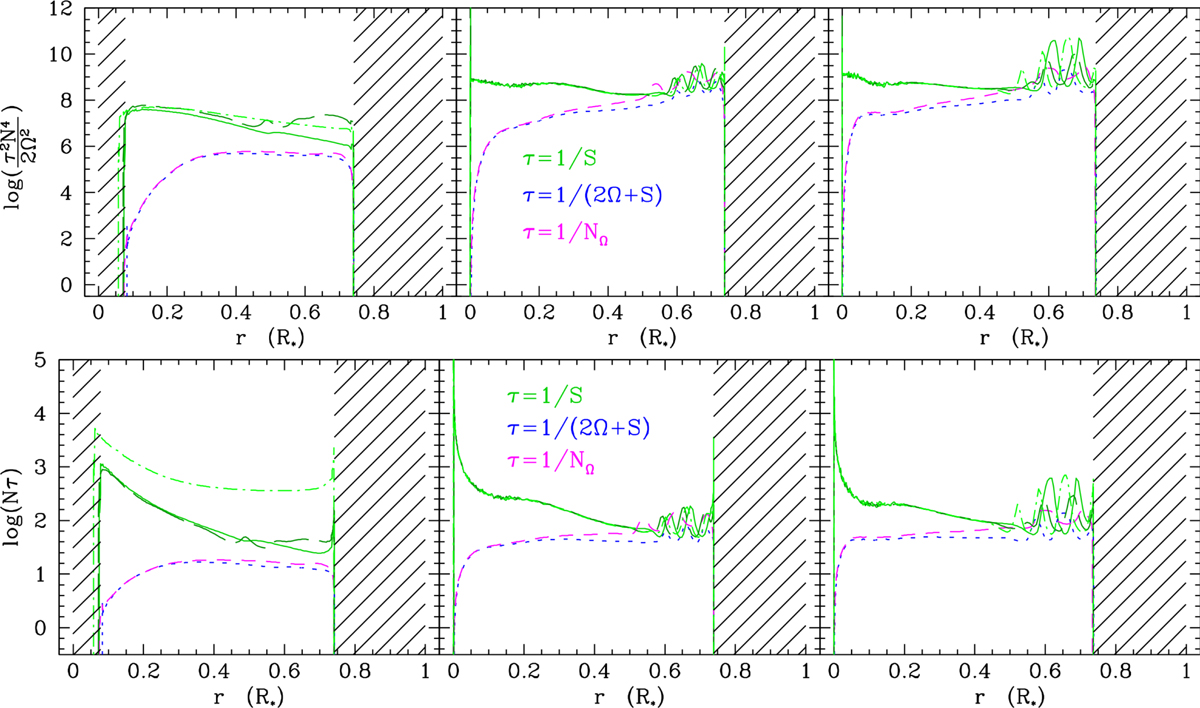
Top row: anisotropic ratio given by Eq. (47) for the different choices of τ. It represents the potential anisotropy of turbulence sustained by the vertical shear instability in the stably stratified differentially rotating medium. It is thus equivalent to the ratio between the horizontal and vertical turbulent diffusivities (Dh,v/Dv, v) when the latter is active. Bottom row: product of the thermal part of the Brunt–Väisälä frequency (N) by the computed turbulent characteristic time (τ). Both are shown at the same evolutionary stages and with the same colour code as in Fig 2.
Current usage metrics show cumulative count of Article Views (full-text article views including HTML views, PDF and ePub downloads, according to the available data) and Abstracts Views on Vision4Press platform.
Data correspond to usage on the plateform after 2015. The current usage metrics is available 48-96 hours after online publication and is updated daily on week days.
Initial download of the metrics may take a while.