Fig. 8.
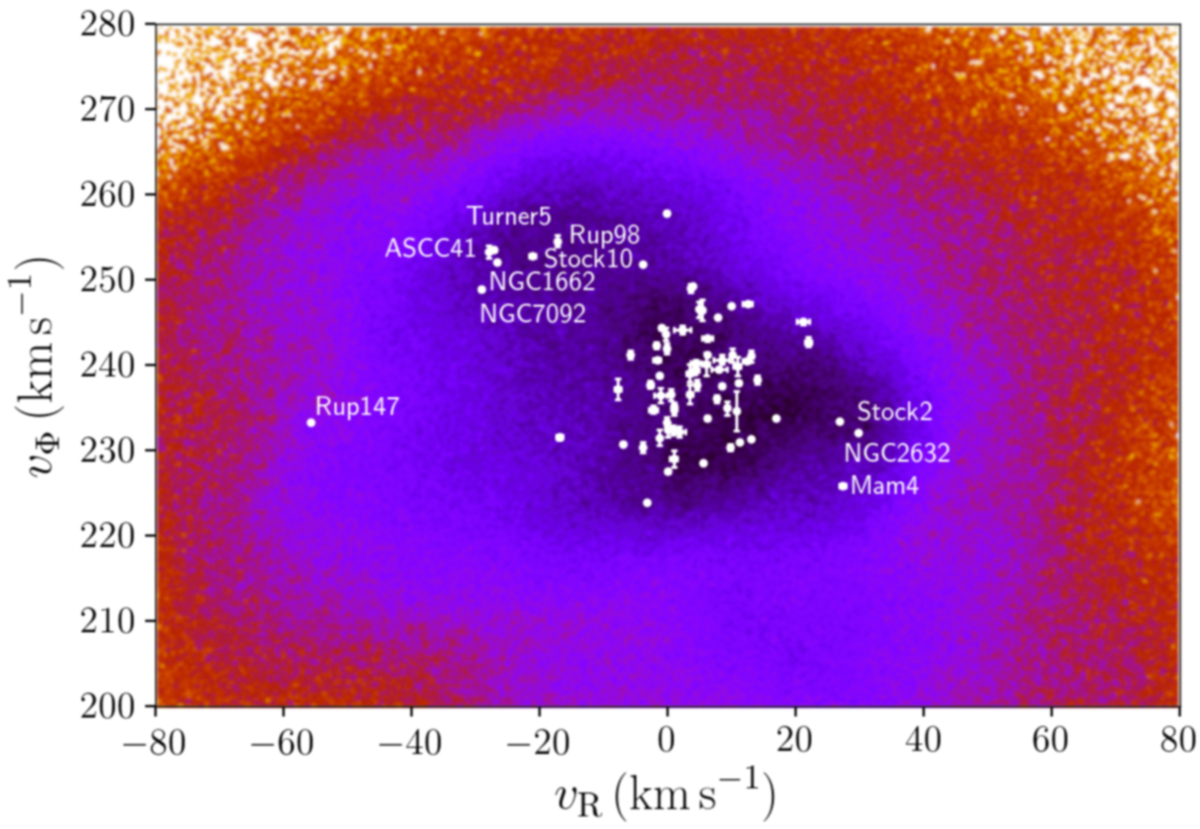
Velocity distribution of nearby OCs (dist ≤ 500 pc) in (VR, Vϕ), superimposed on field stars in the same volume around the Sun taken from Gaia Collaboration (2018c). The most extreme OCs are indicated, in particular, the two groups listed in Table 2.
Current usage metrics show cumulative count of Article Views (full-text article views including HTML views, PDF and ePub downloads, according to the available data) and Abstracts Views on Vision4Press platform.
Data correspond to usage on the plateform after 2015. The current usage metrics is available 48-96 hours after online publication and is updated daily on week days.
Initial download of the metrics may take a while.