Fig. 6.
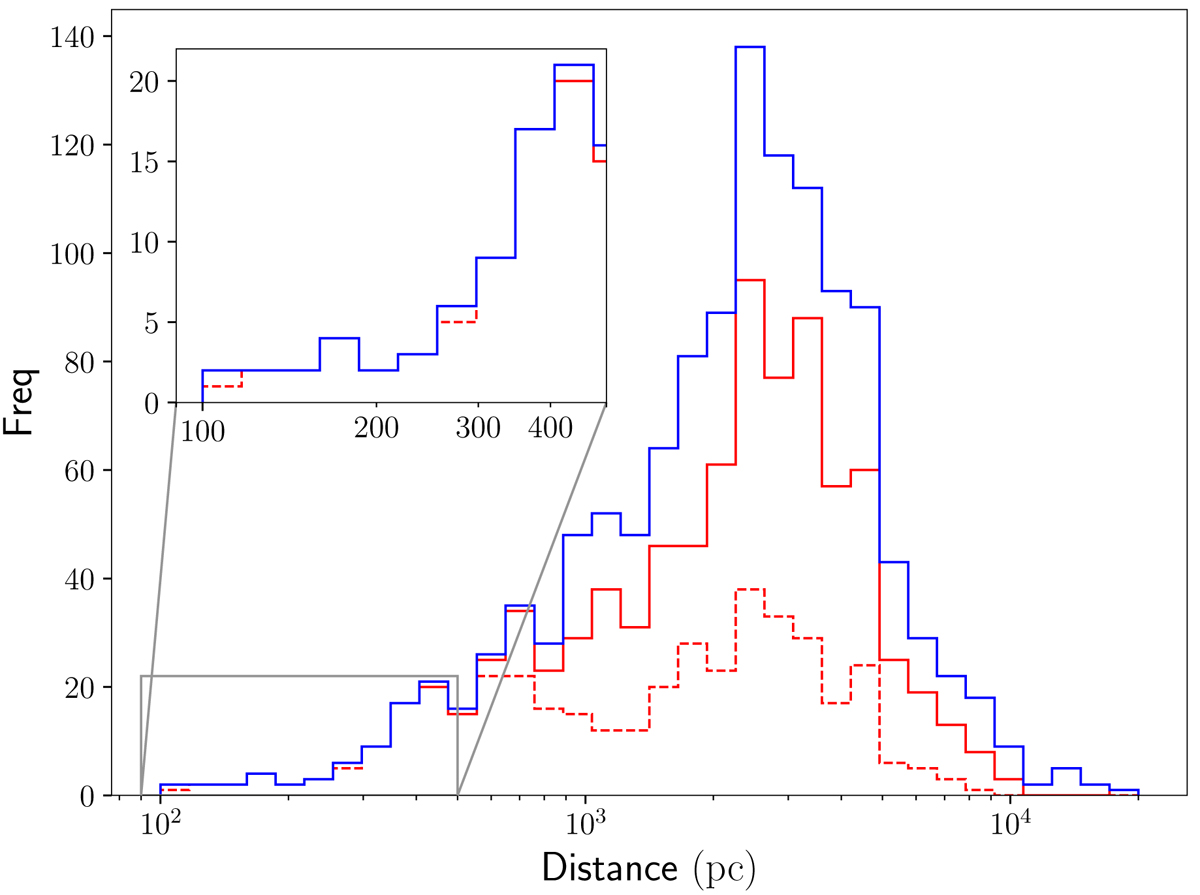
Histogram of OC distances as listed in Paper I (in blue) for the 861 OCs with a Gaia DR2 RV determination (in red) and for the 406 OCs of the high-quality sample (dotted red). A zoom on nearby OCs is presented in the inset panel.
Current usage metrics show cumulative count of Article Views (full-text article views including HTML views, PDF and ePub downloads, according to the available data) and Abstracts Views on Vision4Press platform.
Data correspond to usage on the plateform after 2015. The current usage metrics is available 48-96 hours after online publication and is updated daily on week days.
Initial download of the metrics may take a while.