Fig. 2.
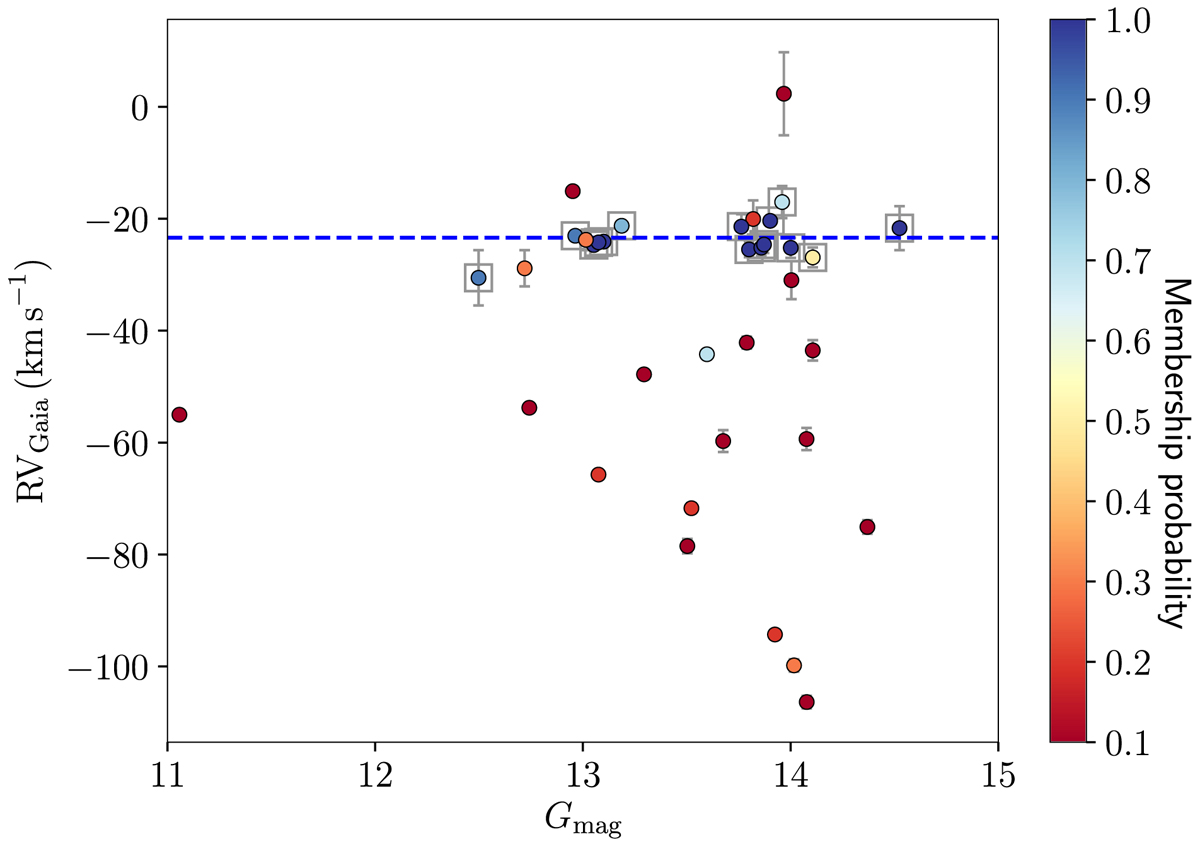
Distribution of RV as a function of G magnitude for the 36 members of Skiff J0058+68.4 with a colour code corresponding to the membership probability, shown as an example. The error bars are the RV uncertainties provided in the Gaia DR2 catalogue. The 15 stars used for the calculation of the weighted RV mean are shown as open squares. The mean value, −23.4 km s−1, is shown as a blue dotted line.
Current usage metrics show cumulative count of Article Views (full-text article views including HTML views, PDF and ePub downloads, according to the available data) and Abstracts Views on Vision4Press platform.
Data correspond to usage on the plateform after 2015. The current usage metrics is available 48-96 hours after online publication and is updated daily on week days.
Initial download of the metrics may take a while.