Free Access
Fig. 2
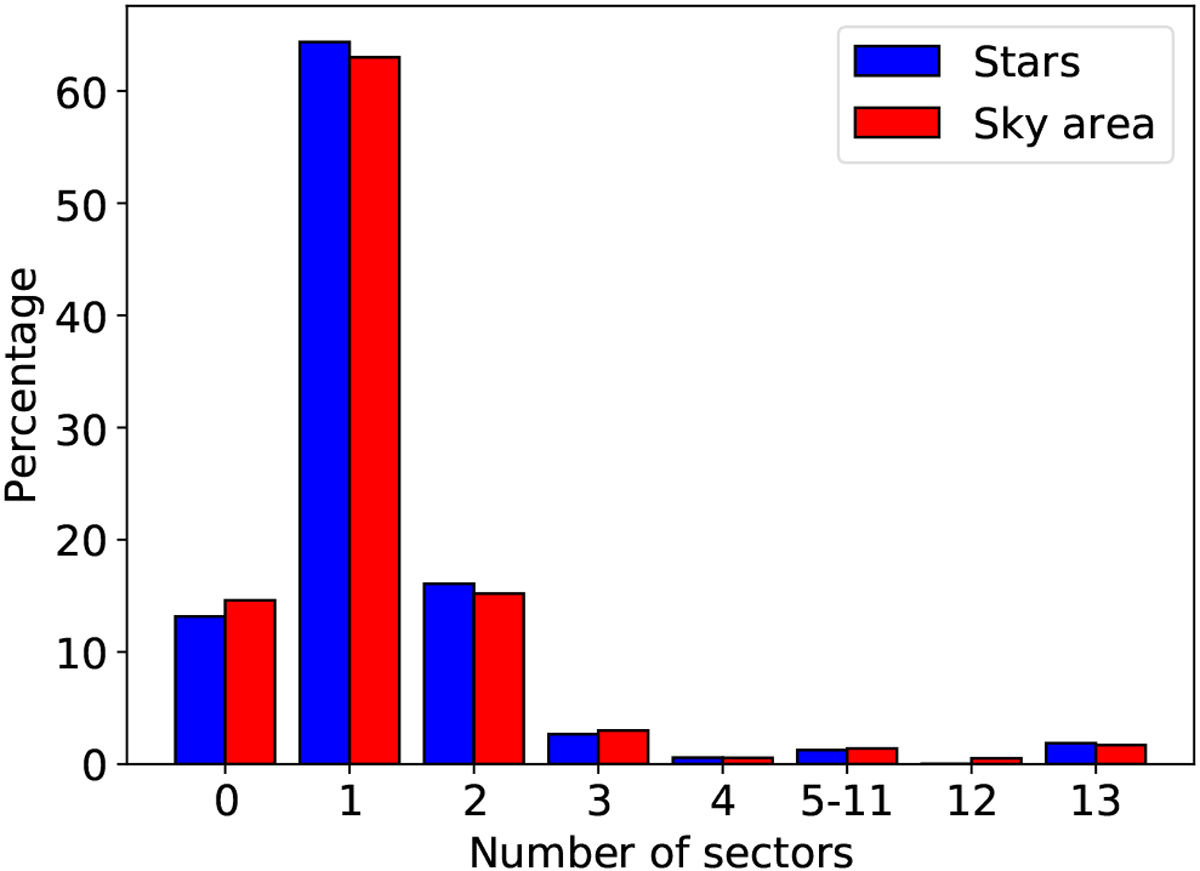
TESSsky coverage showing area of sky observed by combinations of regions. Sky areas observed by more than 4 and less than 12 regions are combined as individually these regions are very small. The plot shows sky area in red and number of stars in blue, both given as a percentage of the total.
Current usage metrics show cumulative count of Article Views (full-text article views including HTML views, PDF and ePub downloads, according to the available data) and Abstracts Views on Vision4Press platform.
Data correspond to usage on the plateform after 2015. The current usage metrics is available 48-96 hours after online publication and is updated daily on week days.
Initial download of the metrics may take a while.