Free Access
Fig. 12
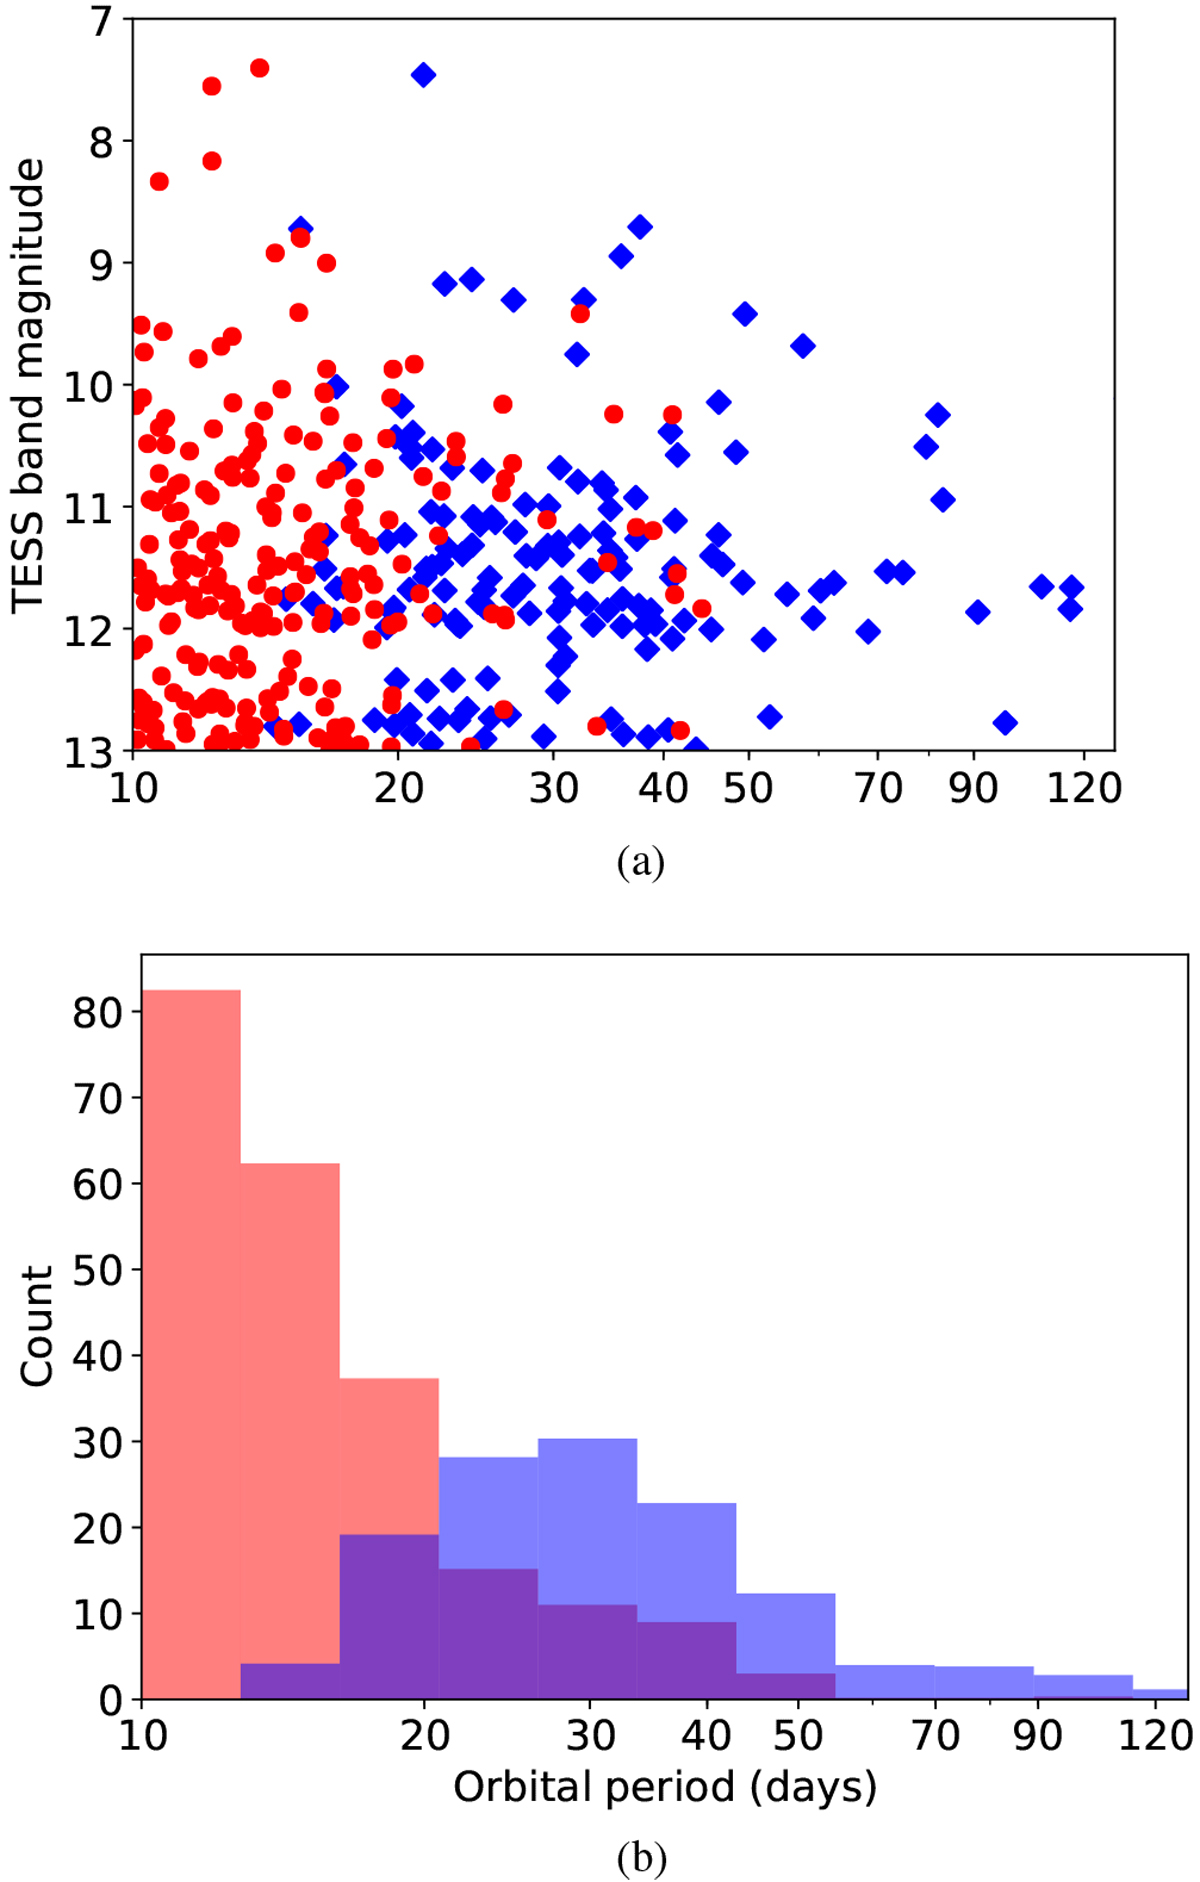
Panel a: all TESS detections with at least 5% transit depth. Additionally, this plot is restricted to mTESS ≤ 13 and P ≥ 10 days. The red circles denote multitransit detections with blue diamonds showing single transits. Panel b: corresponding histogram. Colours and limits are as before.
Current usage metrics show cumulative count of Article Views (full-text article views including HTML views, PDF and ePub downloads, according to the available data) and Abstracts Views on Vision4Press platform.
Data correspond to usage on the plateform after 2015. The current usage metrics is available 48-96 hours after online publication and is updated daily on week days.
Initial download of the metrics may take a while.