Fig. 11
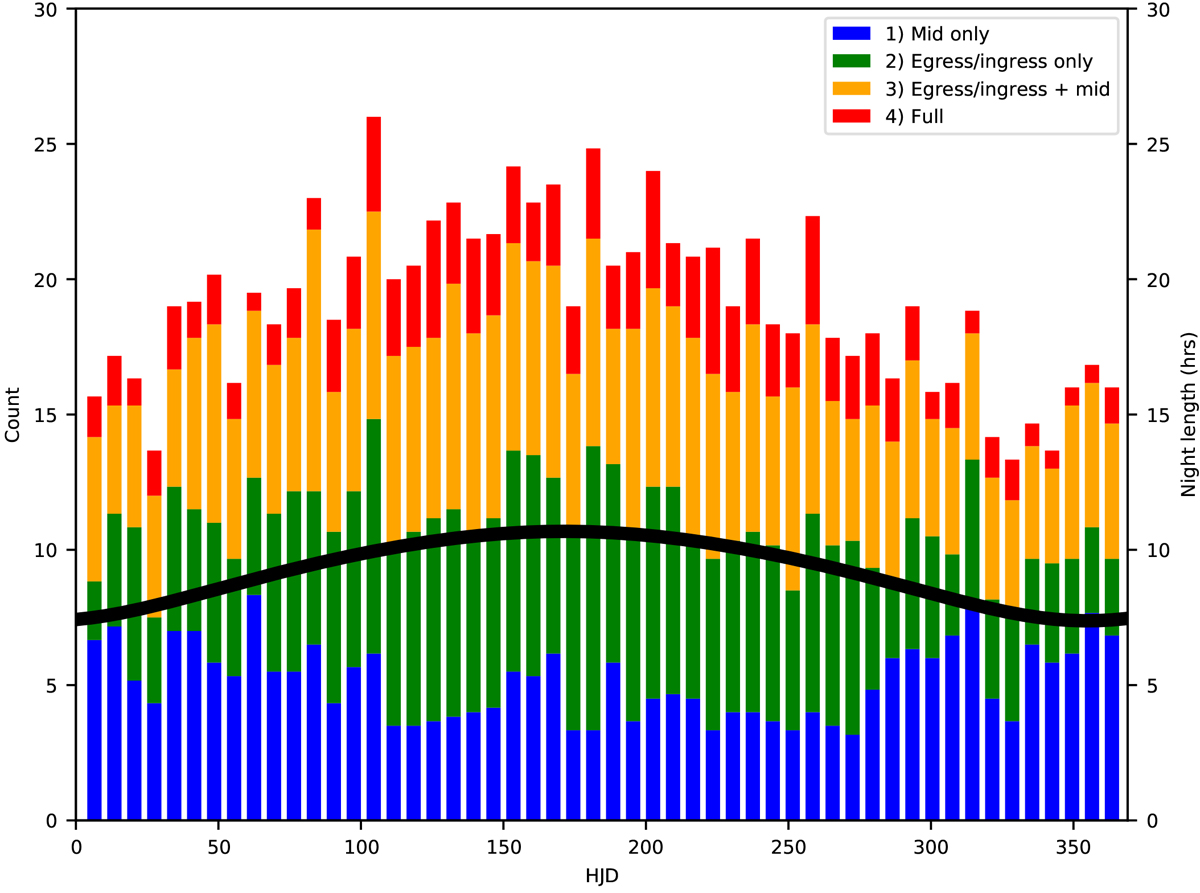
Distribution of TESS single transits visible from Paranal for an arbitrary year. The data has been binned into weeks. The different colours correspond to different amount of the transit being visible. Colours blue, green, yellow and red corresponded to transits of the types 1, 2, 3 and 4 as described in the text. Additionally, the thick black line indicates the length of a Paranal night in hours. The HJD value is offset to run from 0–365 to cover 1 yr of observations.
Current usage metrics show cumulative count of Article Views (full-text article views including HTML views, PDF and ePub downloads, according to the available data) and Abstracts Views on Vision4Press platform.
Data correspond to usage on the plateform after 2015. The current usage metrics is available 48-96 hours after online publication and is updated daily on week days.
Initial download of the metrics may take a while.