Fig. 10
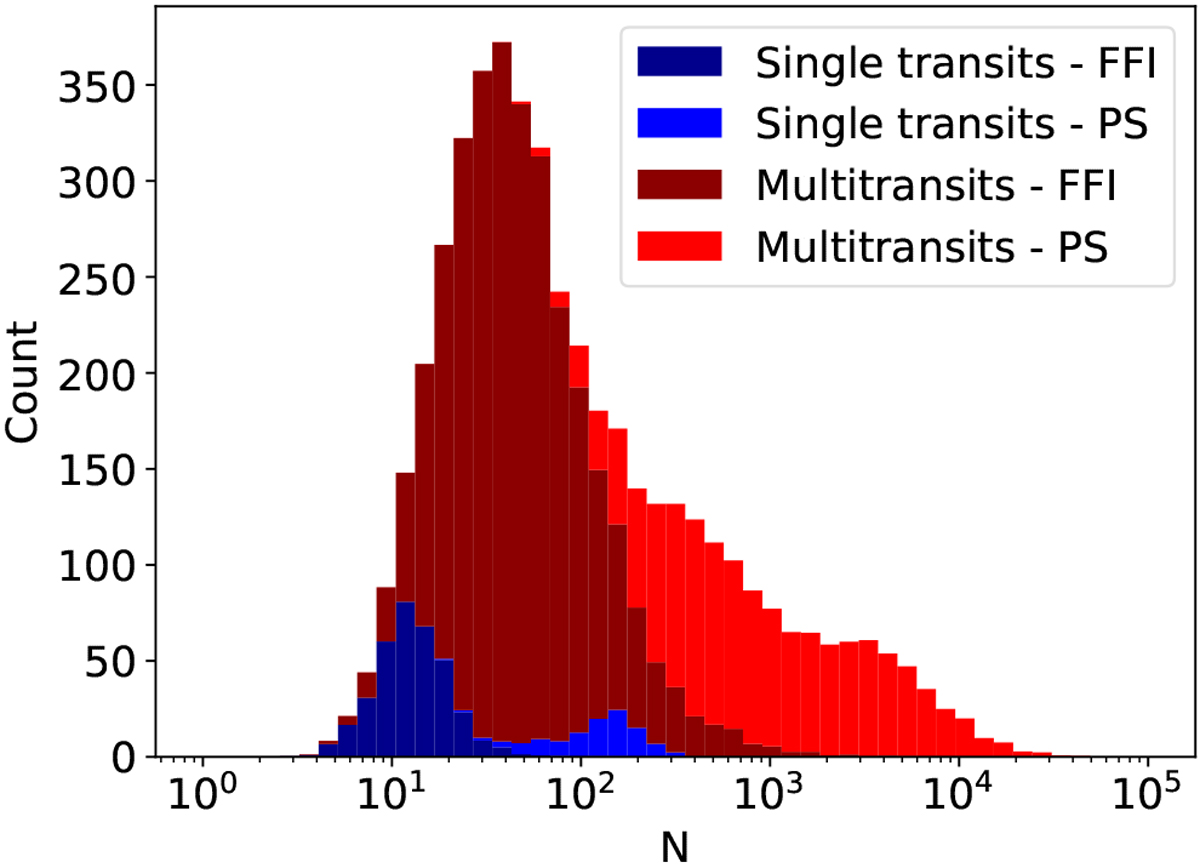
Distribution of detectable planets with N, averaged from multiple simulation runs. This plot shows the distribution broken down by number of transits observed (multiple or single transits) and observing cadence (2 or 30 min). The four distributions are stacked so the maximum height of each bar shows the total detections for each N.
Current usage metrics show cumulative count of Article Views (full-text article views including HTML views, PDF and ePub downloads, according to the available data) and Abstracts Views on Vision4Press platform.
Data correspond to usage on the plateform after 2015. The current usage metrics is available 48-96 hours after online publication and is updated daily on week days.
Initial download of the metrics may take a while.