Free Access
Fig. 3
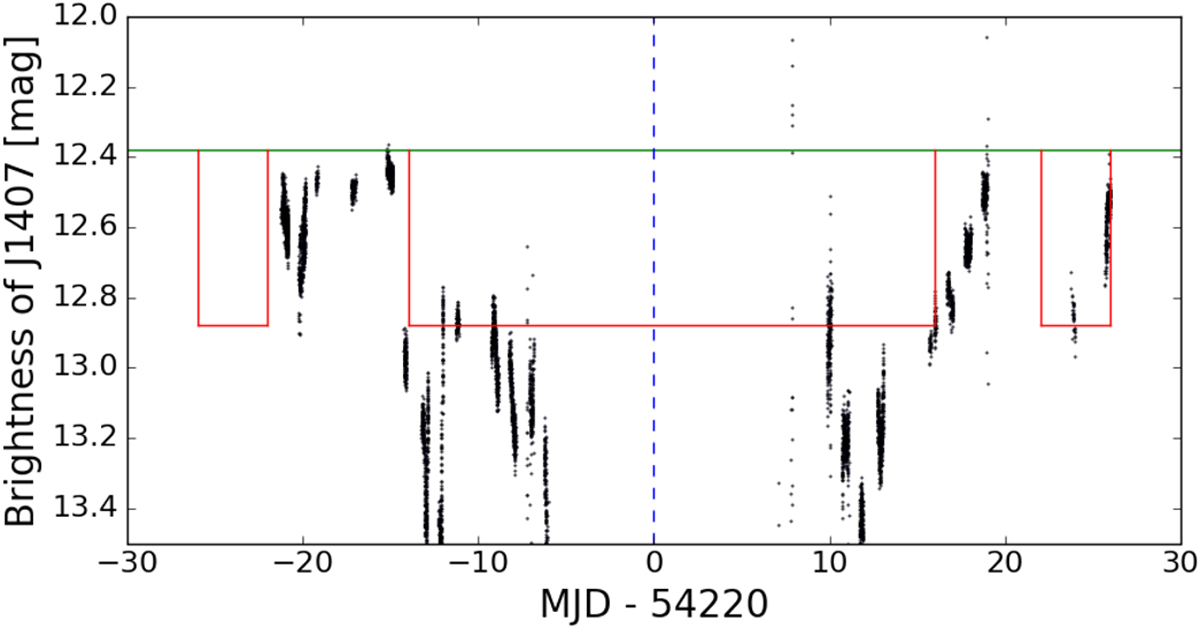
Lightcurve of the 2007 transit from the SuperWASP-South observatory (black points). The eclipse is approximated with three windows (red line) corresponding to the three major dimming events. The centre of the transit is marked with a dashed blue line at around MJD 54220.
Current usage metrics show cumulative count of Article Views (full-text article views including HTML views, PDF and ePub downloads, according to the available data) and Abstracts Views on Vision4Press platform.
Data correspond to usage on the plateform after 2015. The current usage metrics is available 48-96 hours after online publication and is updated daily on week days.
Initial download of the metrics may take a while.