Fig. 9.
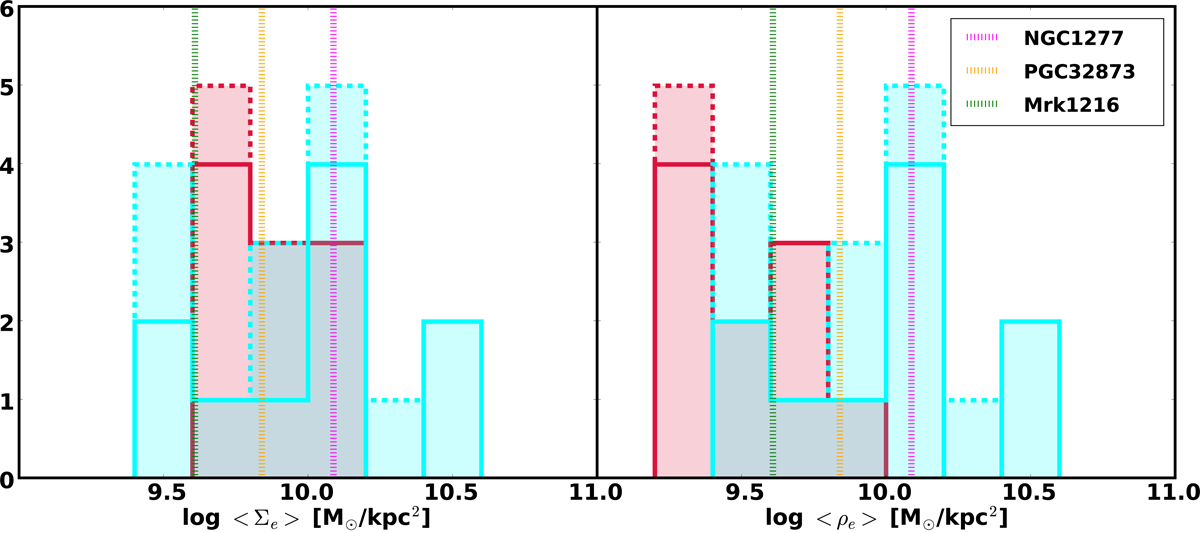
Left panel: histogram with the 2D stellar mass density within one effective radius (![]() ) of our MUG sample, split between disk- (blue) and spheroid-like (red) morphology (n < 2.5 and n > 2.5, respectively). The solid histogram denotes the objects with M⋆ > 8 × 10¹⁰ M⊙ and the dashed one those with 6 × 10¹⁰ < M⋆/M⊙ < 8 × 10¹⁰. Overplotted, as vertical dotted lines, are the values for the confirmed relic galaxies in Ferré-Mateu et al. (2017). The MUGs in our study span the range of values expected of relic galaxies. Right panel: histogram showing the 3D stellar mass density within one effective radius of our MUG sample, again dividing it between M⋆ > 8 × 10¹⁰ M⊙ (solid histogram) and 6 × 10¹⁰ < M⋆/M⊙ < 8 × 10¹⁰ (dashed histogram). We split the galaxies into disk- (blue) and spheroid-like (red) morphology (n < 2.5 and n > 2.5, respectively). We also compute their densities differently:
) of our MUG sample, split between disk- (blue) and spheroid-like (red) morphology (n < 2.5 and n > 2.5, respectively). The solid histogram denotes the objects with M⋆ > 8 × 10¹⁰ M⊙ and the dashed one those with 6 × 10¹⁰ < M⋆/M⊙ < 8 × 10¹⁰. Overplotted, as vertical dotted lines, are the values for the confirmed relic galaxies in Ferré-Mateu et al. (2017). The MUGs in our study span the range of values expected of relic galaxies. Right panel: histogram showing the 3D stellar mass density within one effective radius of our MUG sample, again dividing it between M⋆ > 8 × 10¹⁰ M⊙ (solid histogram) and 6 × 10¹⁰ < M⋆/M⊙ < 8 × 10¹⁰ (dashed histogram). We split the galaxies into disk- (blue) and spheroid-like (red) morphology (n < 2.5 and n > 2.5, respectively). We also compute their densities differently: ![]() h for disks (with h = 1 kpc), and
h for disks (with h = 1 kpc), and ![]() for spheroids. Overplotted are the values of the confirmed local relic galaxies from Ferré-Mateu et al. (2017) – using our formula for disks. On average, disks appear slightly denser than spheroids.
for spheroids. Overplotted are the values of the confirmed local relic galaxies from Ferré-Mateu et al. (2017) – using our formula for disks. On average, disks appear slightly denser than spheroids.
Current usage metrics show cumulative count of Article Views (full-text article views including HTML views, PDF and ePub downloads, according to the available data) and Abstracts Views on Vision4Press platform.
Data correspond to usage on the plateform after 2015. The current usage metrics is available 48-96 hours after online publication and is updated daily on week days.
Initial download of the metrics may take a while.