Fig. 7.
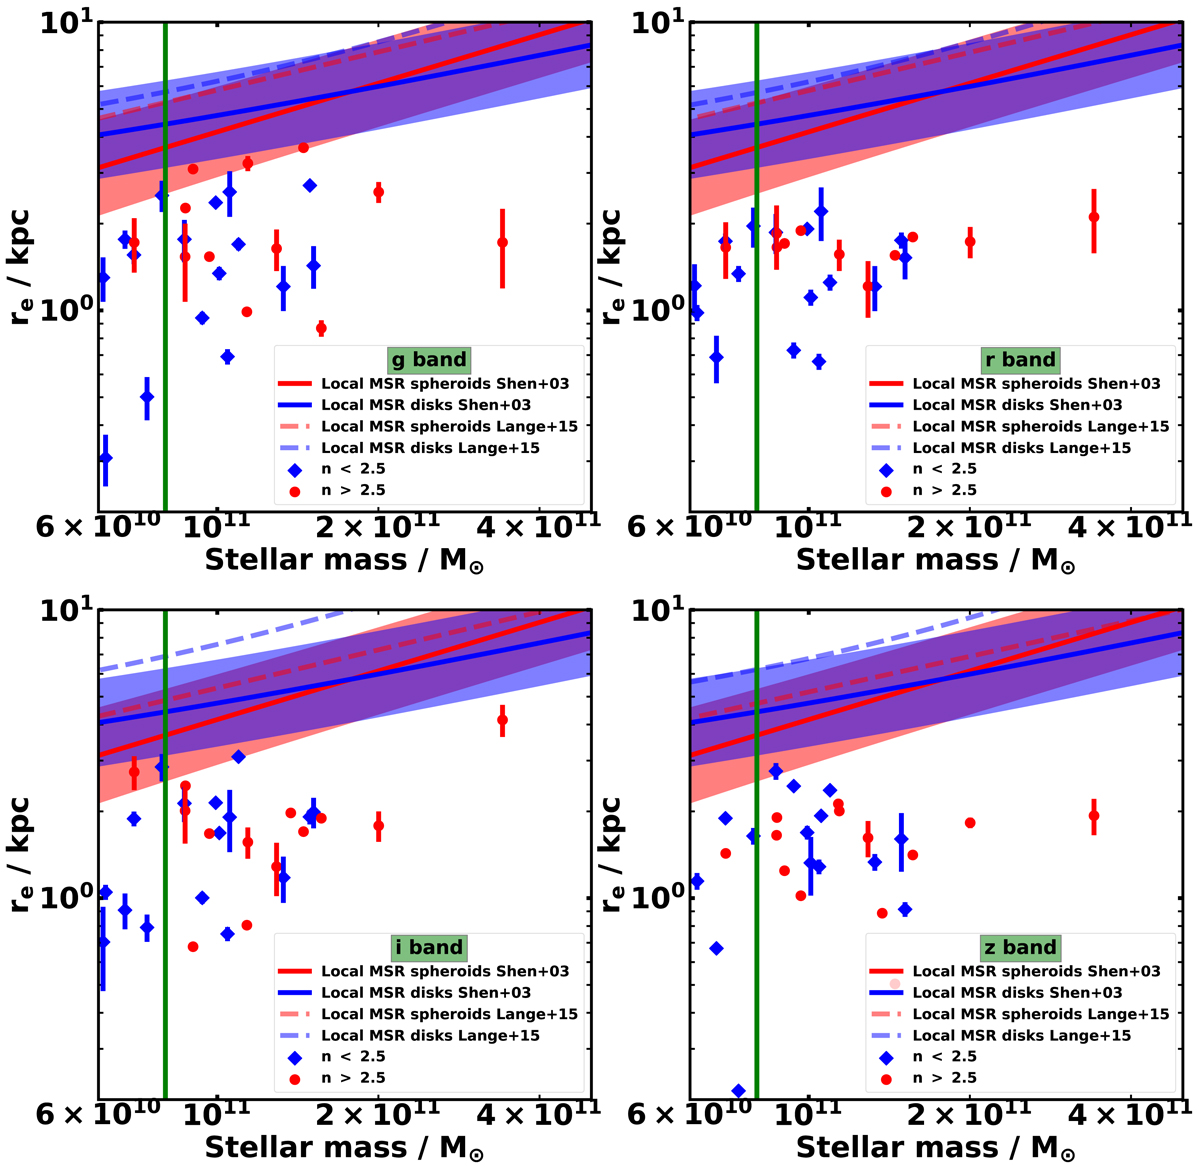
Mass-size relation in all bands included in our study (from top to bottom, from left to right panels: g-, r-, i- and Z-band). Objects are split with respect to the surface brightness profile into disk-like (n < 2.5; in blue) and spheroid-like (n > 2.5; in red). The green vertical line separates the objects in the main sample (Mstellar ≥ 8 × 10¹⁰ M⊙) from those that might be compatible if we include the mass uncertainties (Mstellar ≥ 6 × 10¹⁰ M⊙). The solid regions represent the canonical SDSS z-band mass-size relation from Shen et al. (2003), including the dispersion. The dashed lines are the equivalent trends for GAMA galaxies from Lange et al. (2015), for each photometric band. The error bars are derived according to the results in our simulations. Note the effective radii for our sample are not circularized.
Current usage metrics show cumulative count of Article Views (full-text article views including HTML views, PDF and ePub downloads, according to the available data) and Abstracts Views on Vision4Press platform.
Data correspond to usage on the plateform after 2015. The current usage metrics is available 48-96 hours after online publication and is updated daily on week days.
Initial download of the metrics may take a while.