Fig. 4.
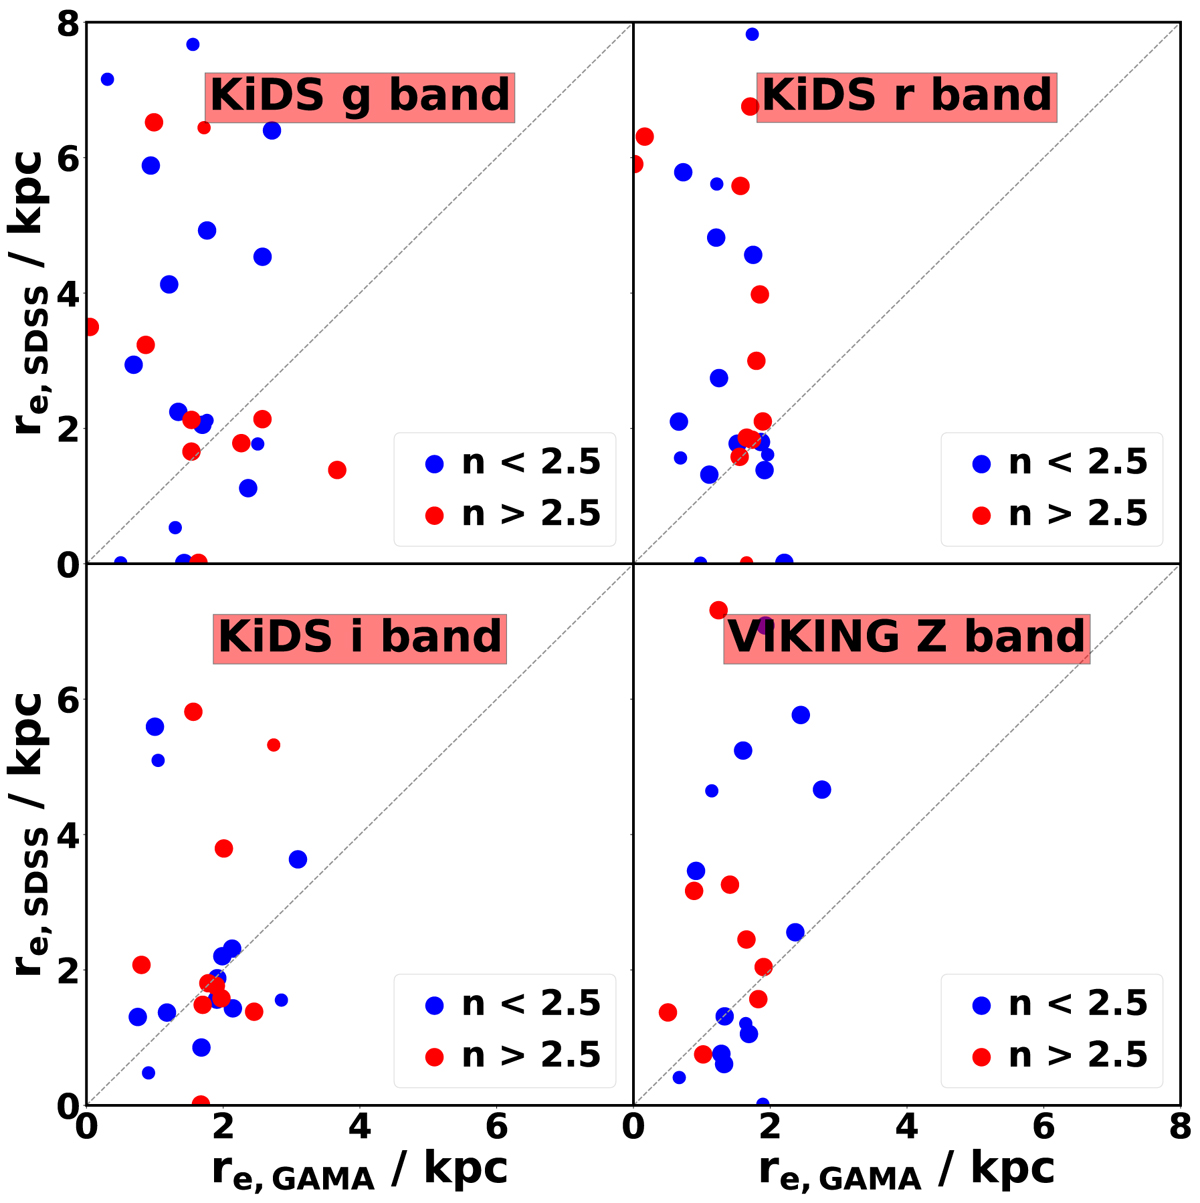
Inferred effective radii in KiDS (g-, r- and i-bands) and VIKING imaging (Z-band) versus the effective radii in SDSS (as described in Kelvin et al. 2012) for the 22+7 objects in our sample. The colour coding follows the Sérsic index, with blue dots being disk-like (n < 2.5) objects and red dots being spheroid-like (n > 2.5) objects. The symbol sizes indicate stellar mass, with big symbols representing > 8 × 10¹⁰ M⊙ galaxies, and small symbols between 6 × 10¹⁰ M⊙ and 8 × 10¹⁰ M⊙. There is little correlation between sizes in the two axes, perhaps only for small galaxies in SDSS being also small in the deeper imaging.
Current usage metrics show cumulative count of Article Views (full-text article views including HTML views, PDF and ePub downloads, according to the available data) and Abstracts Views on Vision4Press platform.
Data correspond to usage on the plateform after 2015. The current usage metrics is available 48-96 hours after online publication and is updated daily on week days.
Initial download of the metrics may take a while.