Fig. 13.
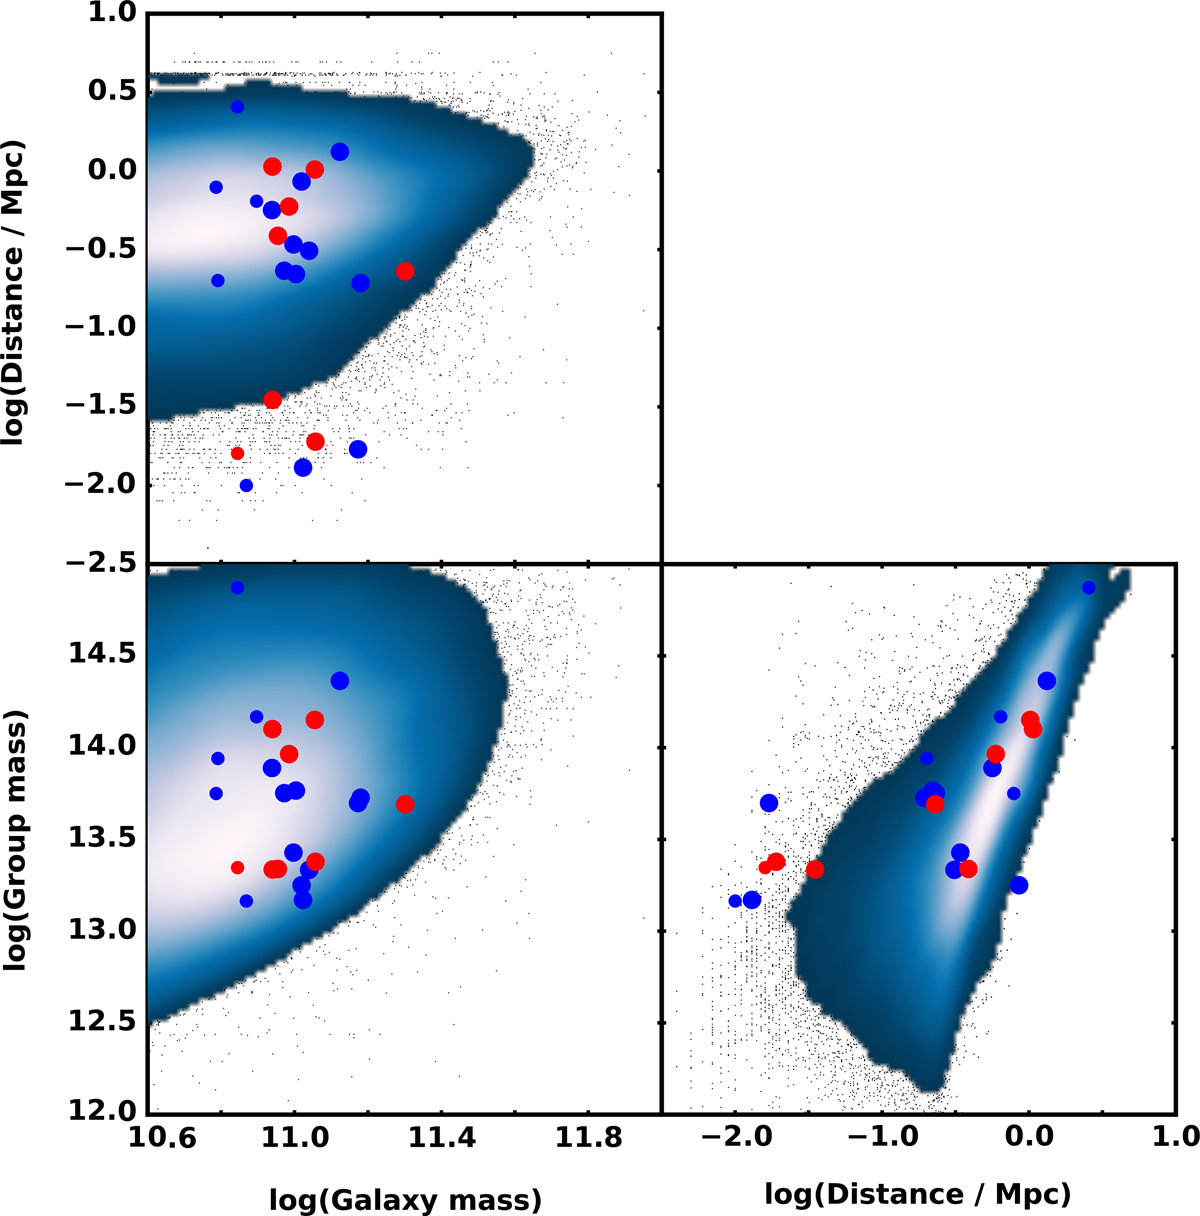
Environment of our MUG sample is compared with the general distribution of GAMA massive galaxies. This is depicted by a blue colored Kernel Density Estimation, using individual datapoints where the density of datapoints is too low. Our MUG sample is colour and size coded as in Fig. 11, split according to the Sérsic index into disk-like (n < 2.5, blue) and spheroid-like (n > 2.5, red). The group dynamical masses and cluster-centric distances distances are taken from the G3C catalogue of Robotham et al. (2011), see text for details.
Current usage metrics show cumulative count of Article Views (full-text article views including HTML views, PDF and ePub downloads, according to the available data) and Abstracts Views on Vision4Press platform.
Data correspond to usage on the plateform after 2015. The current usage metrics is available 48-96 hours after online publication and is updated daily on week days.
Initial download of the metrics may take a while.