Fig. 11.
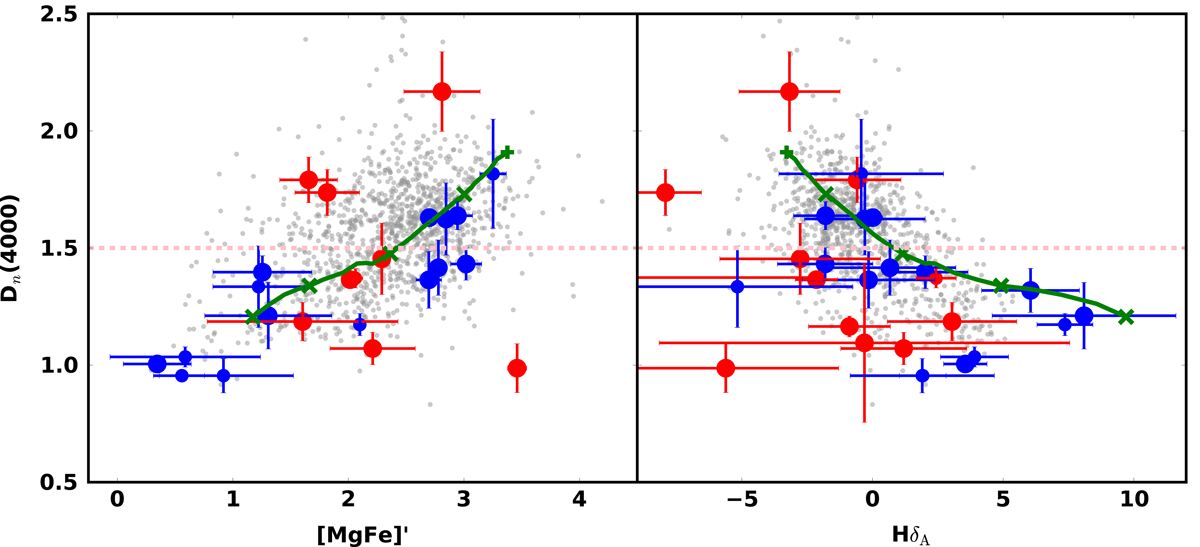
Distribution of age- and metallicity-sensitive line strengths of our MUG sample. The error bars are shown at the 1σ level. The blue (red) circles show the results for galaxies with a Sérsic index n < 2.5 (> 2.5), with their sizes referring to their stellar masses (6−8 × 10¹⁰ M⊙ are depicted by small circles while > 8 × 10¹⁰ M⊙ are the big circles). For reference, we include as grey dots the measurements of the general sample of GAMA massive galaxies (> 1011 M⊙) with AAT/AAOmega spectra. The horizontal dashed line – at Dn(4000)=1.5 – splits the sample between old (above the line) and young populations. The green lines trace the evolution of a simple stellar population at solar metallicity (see text for details).
Current usage metrics show cumulative count of Article Views (full-text article views including HTML views, PDF and ePub downloads, according to the available data) and Abstracts Views on Vision4Press platform.
Data correspond to usage on the plateform after 2015. The current usage metrics is available 48-96 hours after online publication and is updated daily on week days.
Initial download of the metrics may take a while.