Fig. 1.
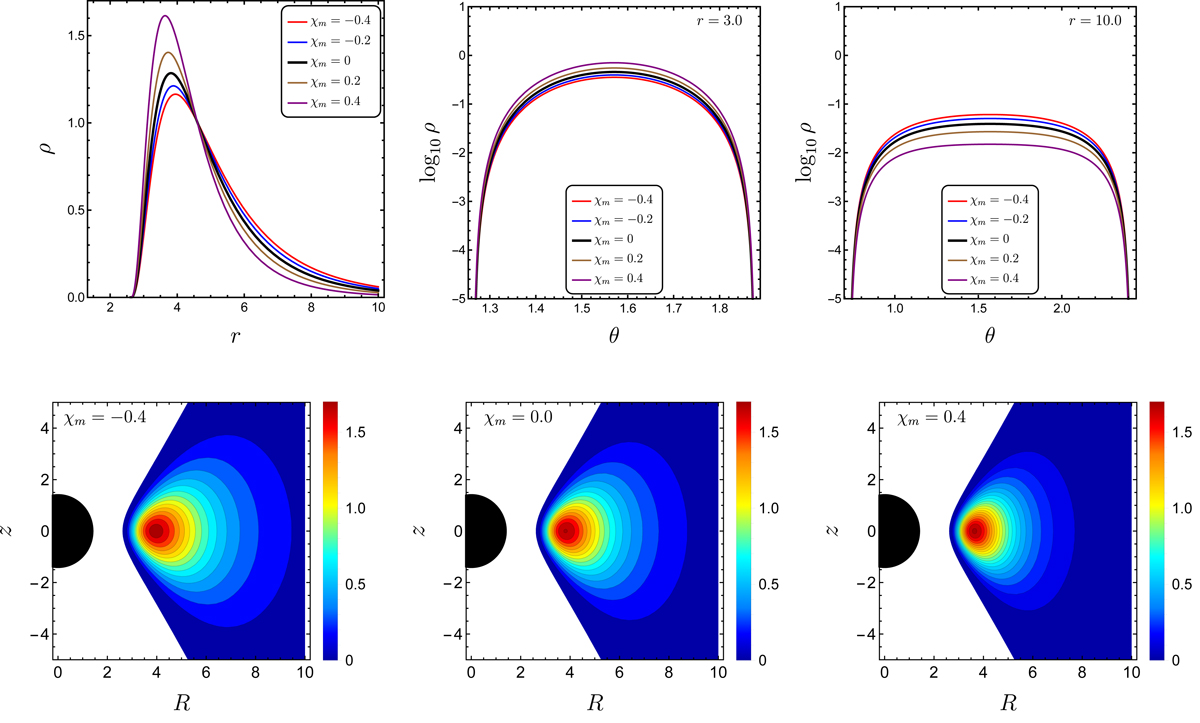
Spatial distribution of the rest mass density ρ for different values of magnetic susceptibility χm. The top-left panel is the radial dependence of ρ on the equatorial plane defined by θ = π/2. The top-center and top-right panels correspond to the angular dependence of ρ in the radial positions r = 3.0 and r = 10.0, respectively. In the top row the black curves correspond to the Komissarov solution, obtained by taking χm = 0. The bottom row shows the density distribution of ρ in the z-R plane, with R = r sin θ and z = r cos θ, for χm = −0.4, 0.0, 0.4.
Current usage metrics show cumulative count of Article Views (full-text article views including HTML views, PDF and ePub downloads, according to the available data) and Abstracts Views on Vision4Press platform.
Data correspond to usage on the plateform after 2015. The current usage metrics is available 48-96 hours after online publication and is updated daily on week days.
Initial download of the metrics may take a while.