Free Access
Fig. 1.
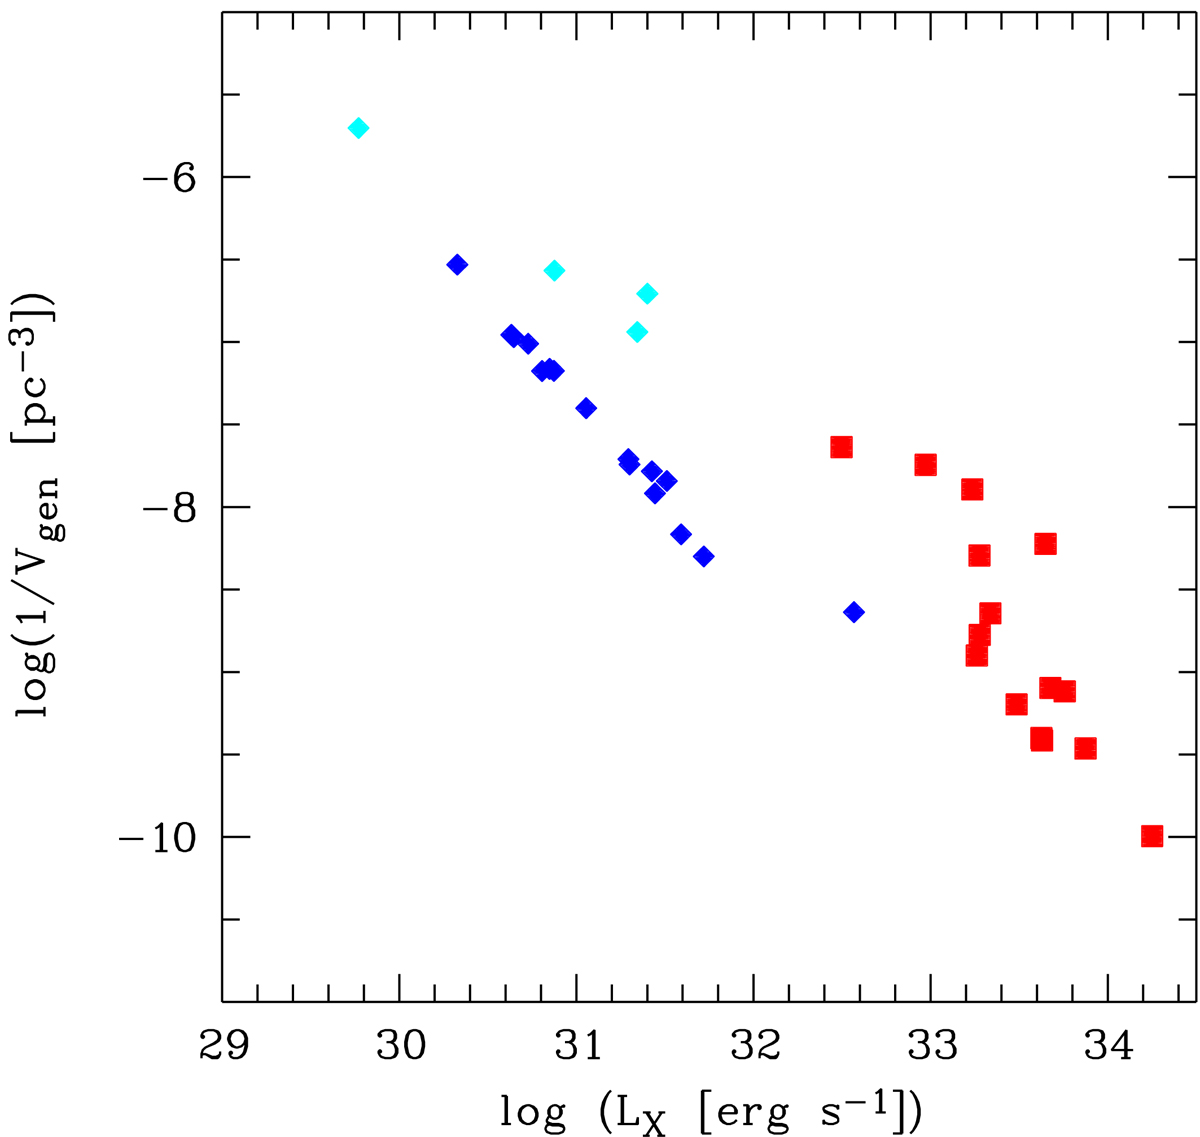
Scatter plot showing the X-ray luminosities and the weights (inverse of the generic volumes) per object studied here. The Swift/BAT selected IPS are shown in red for a scale height of 120 pc, the RASS CVs are shown in blue, and the NEP-CVs in the RASS sample in cyan. Assumed scale height for RASS-CVs was 260 pc.
Current usage metrics show cumulative count of Article Views (full-text article views including HTML views, PDF and ePub downloads, according to the available data) and Abstracts Views on Vision4Press platform.
Data correspond to usage on the plateform after 2015. The current usage metrics is available 48-96 hours after online publication and is updated daily on week days.
Initial download of the metrics may take a while.