Fig. 6.
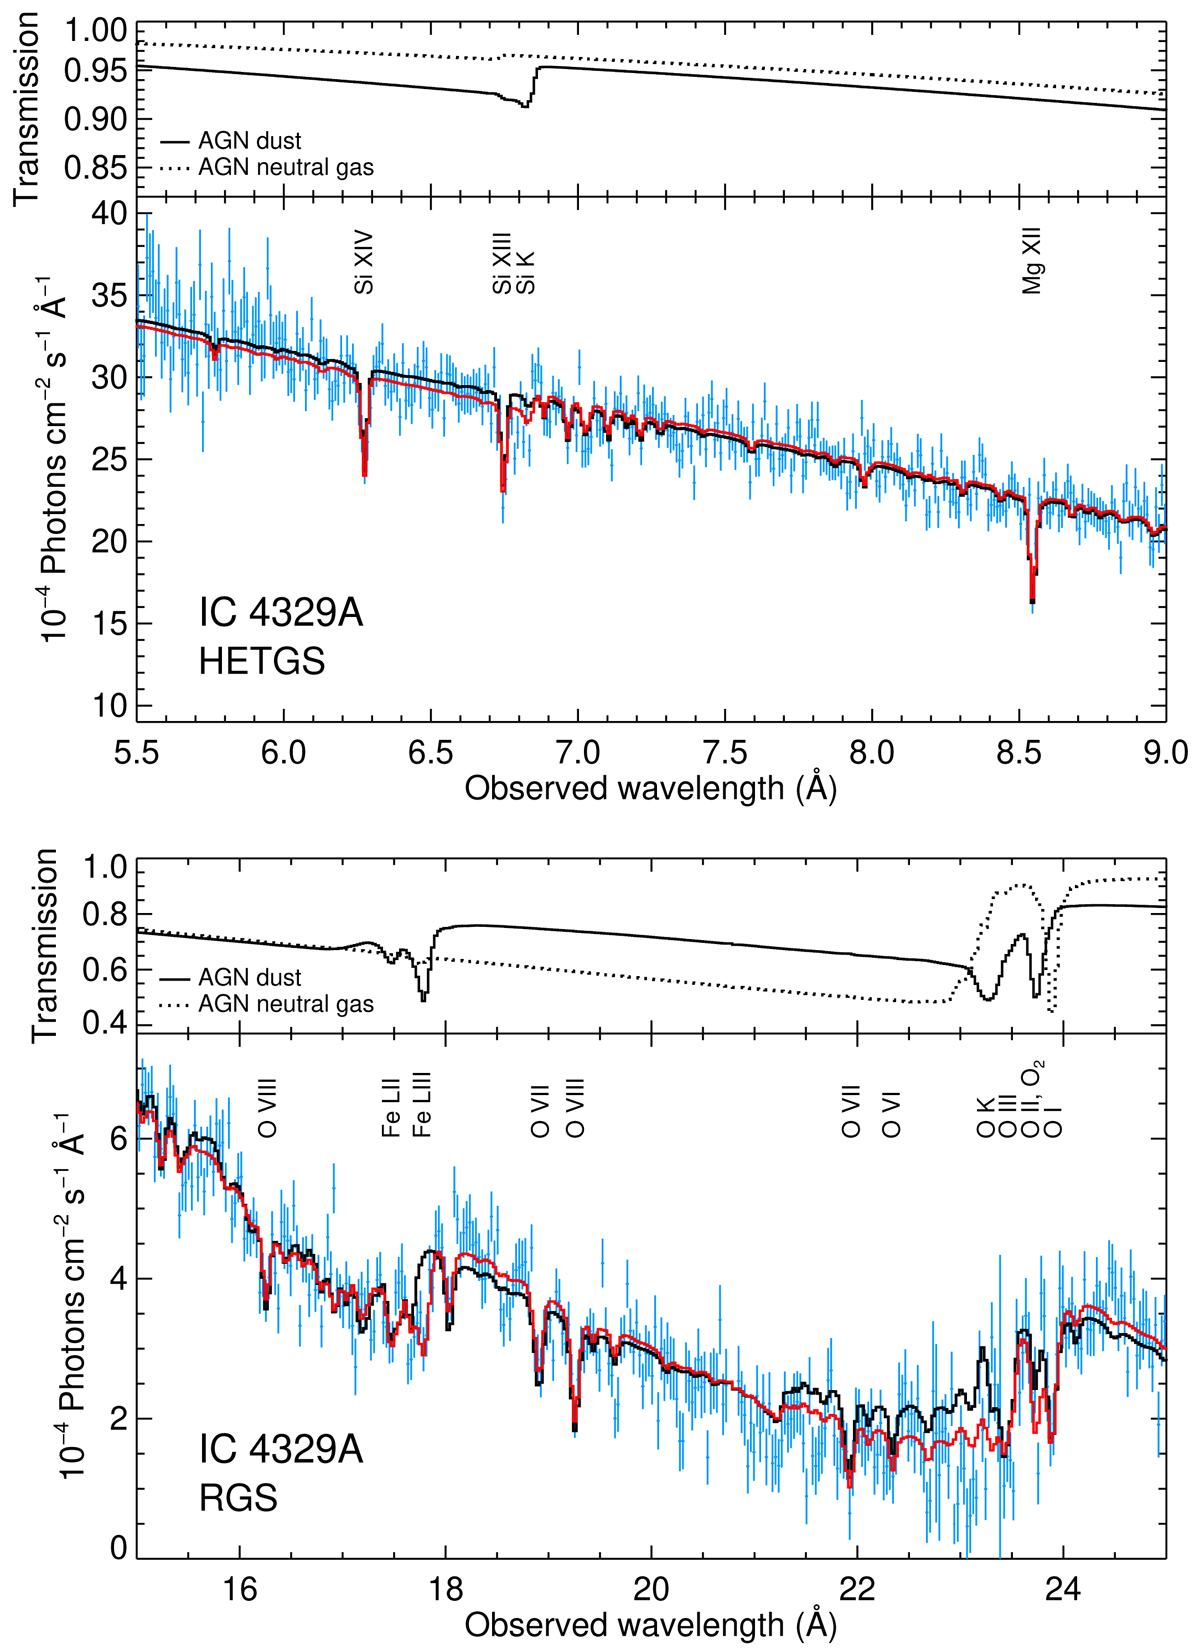
Stacked HETGS (top panel) and RGS (bottom panel) spectra of IC 4329A in the K-band of Si (HETGS) and O (RGS), and the L-band of Fe (RGS). The best-fit model shown in red includes dust, whereas the one in black does not include dust. The panels above each spectrum show the transmission model by the Si, O, and Fe elements in atomic (dotted line) and dust (solid line) form in IC 4329A. The strongest absorption features in the spectrum are labelled, including the K-edge of O and Si, and the LII- and LIII-edges of Fe from dust in the AGN, as well as lines from the ionised AGN wind. The model with dust absorption (shown in red) fits the O K and Fe LIII edges significantly better than the one without dust (shown in black).
Current usage metrics show cumulative count of Article Views (full-text article views including HTML views, PDF and ePub downloads, according to the available data) and Abstracts Views on Vision4Press platform.
Data correspond to usage on the plateform after 2015. The current usage metrics is available 48-96 hours after online publication and is updated daily on week days.
Initial download of the metrics may take a while.