Fig. 5.
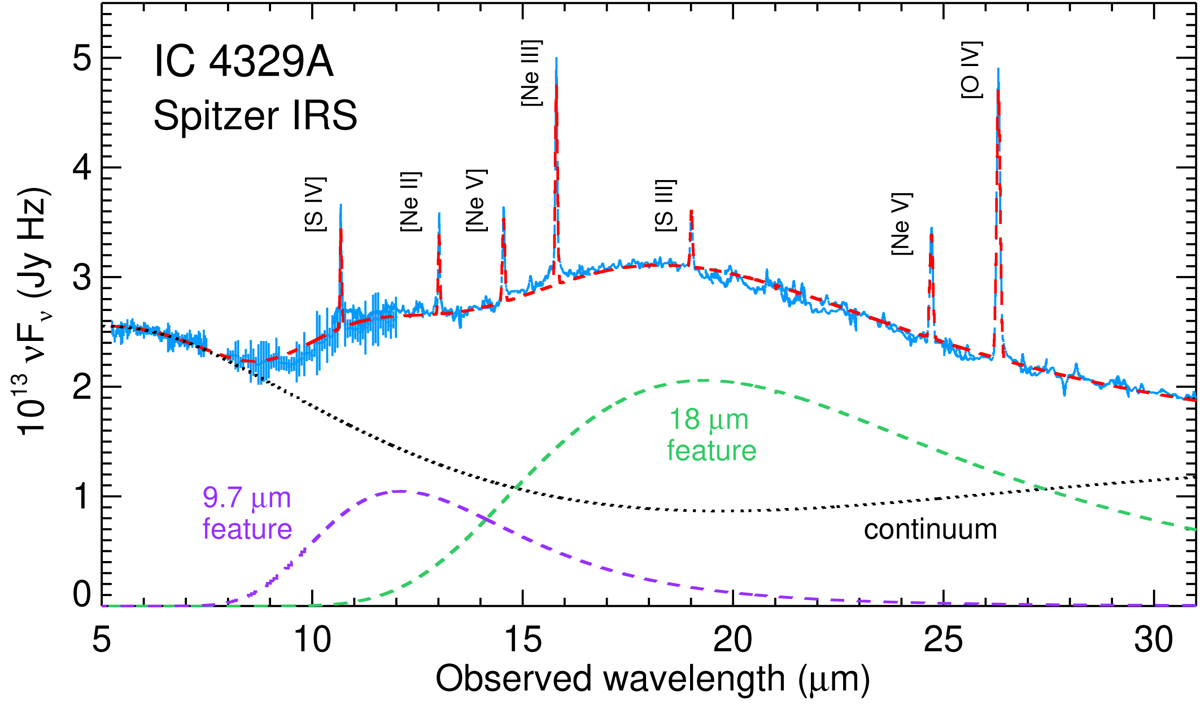
Spitzer IRS spectrum of IC 4329A. The 9.7- and 18-micron emission features are shown in dashed purple and green lines, respectively. The best-fit model to the data, which includes the narrow emission lines from the AGN NLR, is shown in dashed red line. The underlying thermal IR continuum model is shown in dotted black line for comparison.
Current usage metrics show cumulative count of Article Views (full-text article views including HTML views, PDF and ePub downloads, according to the available data) and Abstracts Views on Vision4Press platform.
Data correspond to usage on the plateform after 2015. The current usage metrics is available 48-96 hours after online publication and is updated daily on week days.
Initial download of the metrics may take a while.