Fig. 4.
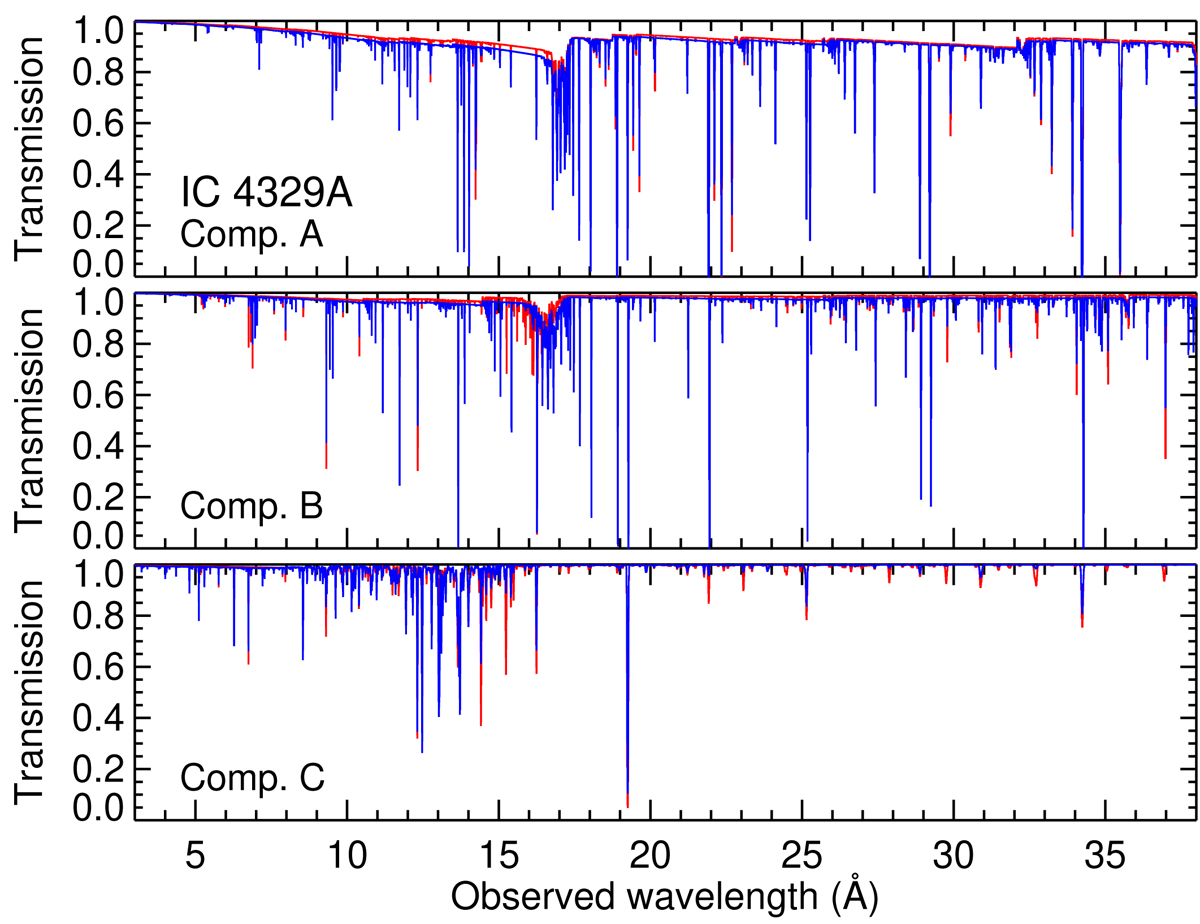
Model transmission spectrum of the three components of the AGN wind in IC 4329A. Comp. A is the lowest-ionisation component, and Comp. C the highest. The model shown in blue is the one derived from the 2017 HETGS observations. The model derived from the archival 2003 XMM-Newton observations is also shown for comparison, which is plotted in red behind the blue one.
Current usage metrics show cumulative count of Article Views (full-text article views including HTML views, PDF and ePub downloads, according to the available data) and Abstracts Views on Vision4Press platform.
Data correspond to usage on the plateform after 2015. The current usage metrics is available 48-96 hours after online publication and is updated daily on week days.
Initial download of the metrics may take a while.