Fig. 3.
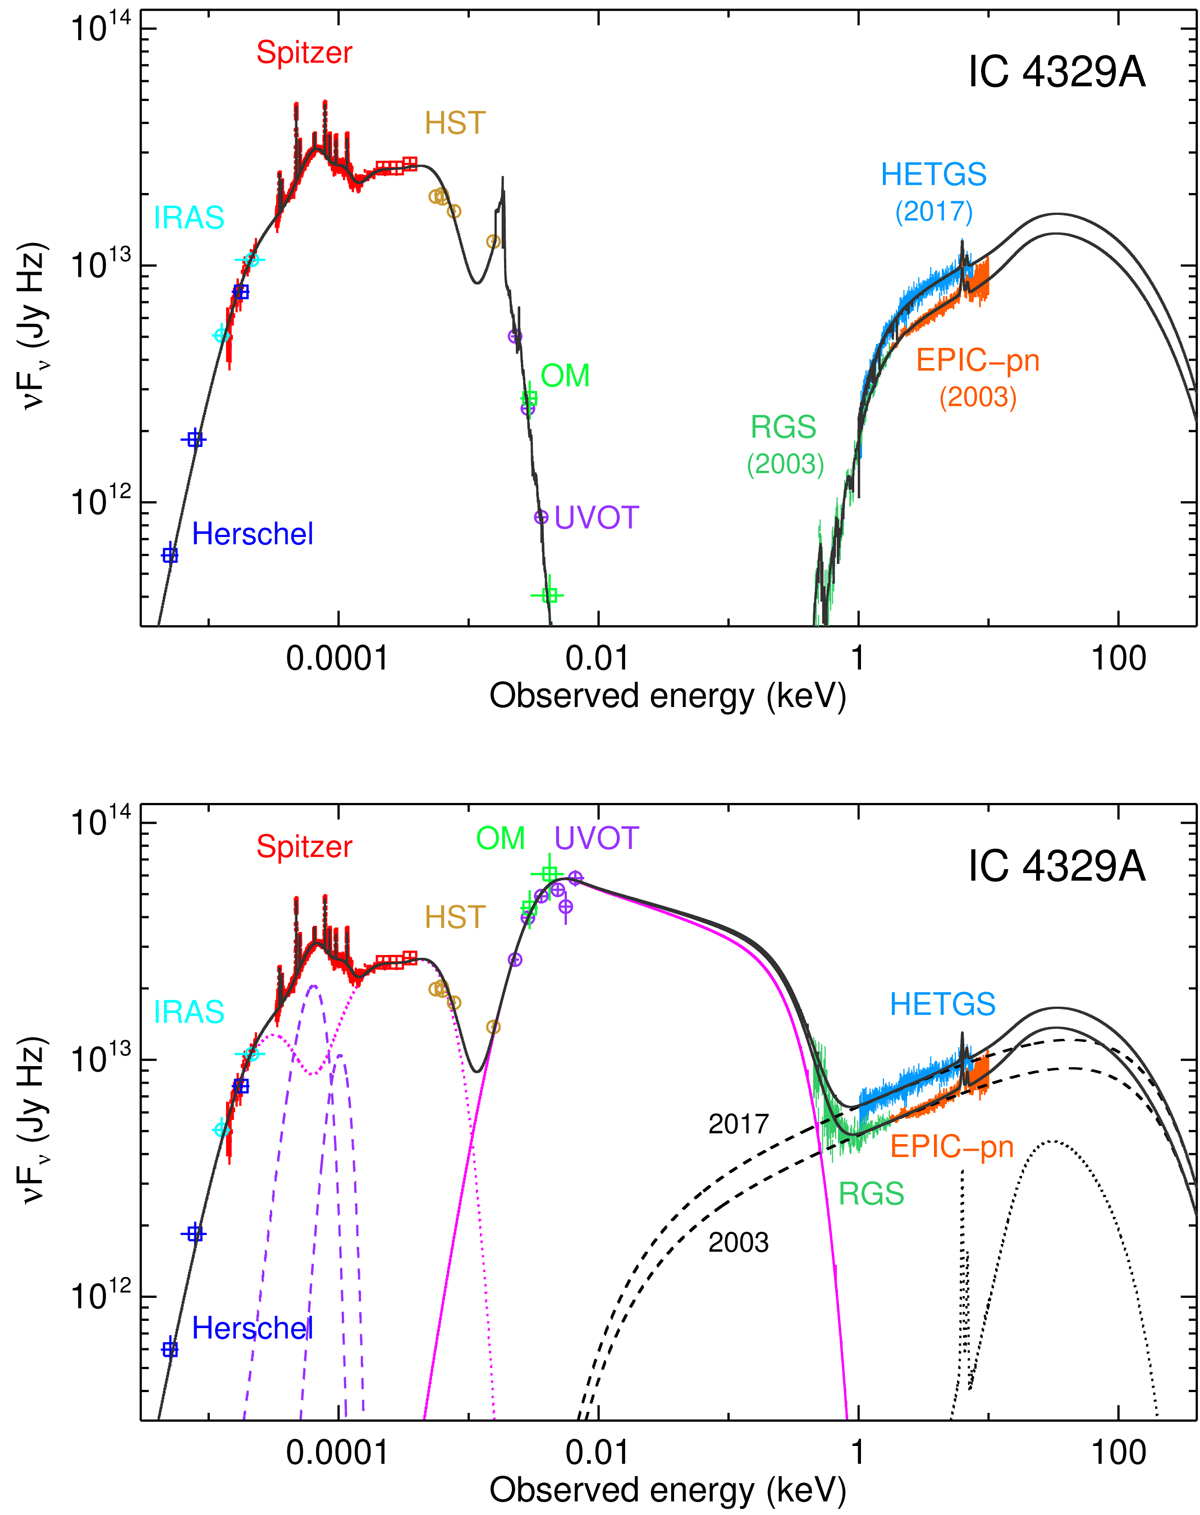
SED of IC 4329A from far-IR to hard X-rays. The SED in the top panel includes the effects of reddening, X-ray absorption, host galaxy starlight emission, and the BLR and NLR emission. The SED in the bottom panel is corrected for these processes, revealing the underlying continuum. The best-fit model to the data is shown in both panels in solid black line. The contribution of individual continuum components are displayed in the bottom panel: a Comptonised disk component (solid magenta line), power-law continuum (dashed black line), X-ray reflection (dotted black line), thermal IR continuum (dotted magenta line). The model for the 9.7 and 18 μm silicate features are also plotted (dashed purple lines). In the 2017 epoch (HETGS observation), the X-ray power-law (dashed black line) is brighter than in the 2003 epoch (XMM-Newton observation).
Current usage metrics show cumulative count of Article Views (full-text article views including HTML views, PDF and ePub downloads, according to the available data) and Abstracts Views on Vision4Press platform.
Data correspond to usage on the plateform after 2015. The current usage metrics is available 48-96 hours after online publication and is updated daily on week days.
Initial download of the metrics may take a while.