Fig. 2.
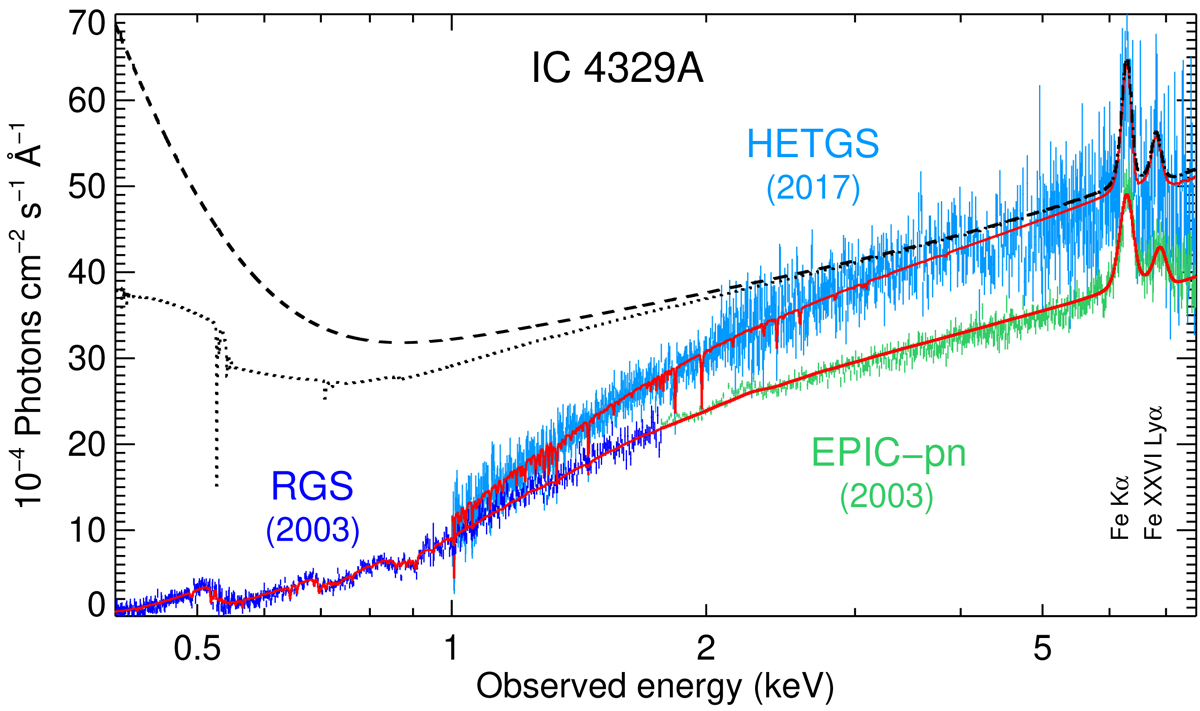
Overview of the X-ray spectrum of IC 4329A taken with XMM-Newton RGS and EPIC-pn in 2003, and Chandra HETGS in 2017. Our best-fit models to the data are also displayed (in red), with the powerlaw continuum being brighter in 2017. The underlying 2017 continuum model without any X-ray absorption is shown in dashed black line. For comparison, the continuum model with only absorption by the Milky Way is shown in dotted black line, which demonstrates the strong intrinsic absorption by IC 4329A.
Current usage metrics show cumulative count of Article Views (full-text article views including HTML views, PDF and ePub downloads, according to the available data) and Abstracts Views on Vision4Press platform.
Data correspond to usage on the plateform after 2015. The current usage metrics is available 48-96 hours after online publication and is updated daily on week days.
Initial download of the metrics may take a while.