Free Access
Fig. 3.
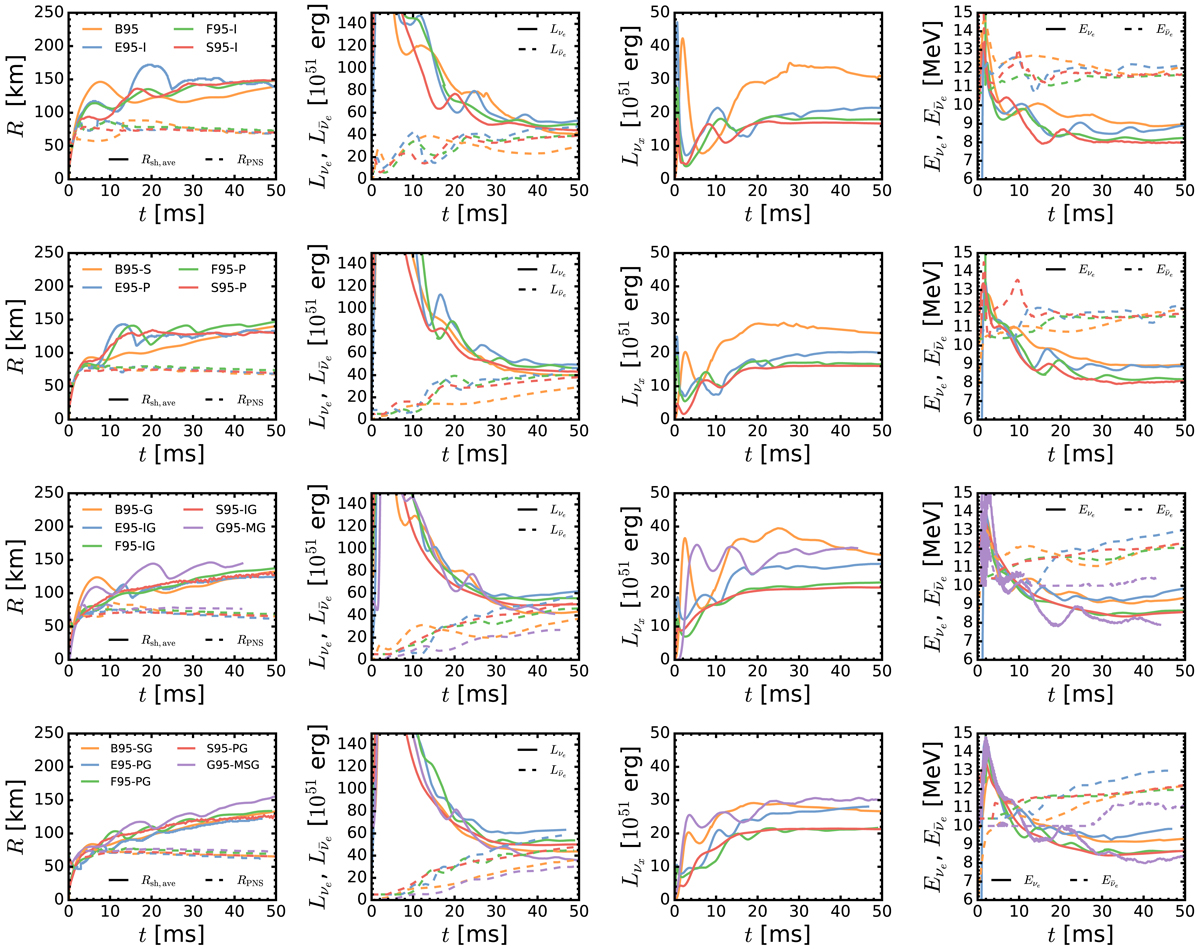
Time evolution of averaged shock radius, PNS radius, neutrino luminosities, and mean energies for different runs. Each row describes a comparison of different physics input as described in Table 2. Different color represents a simulation with a different hydrodynamics code.
Current usage metrics show cumulative count of Article Views (full-text article views including HTML views, PDF and ePub downloads, according to the available data) and Abstracts Views on Vision4Press platform.
Data correspond to usage on the plateform after 2015. The current usage metrics is available 48-96 hours after online publication and is updated daily on week days.
Initial download of the metrics may take a while.