Free Access
Fig. 11.
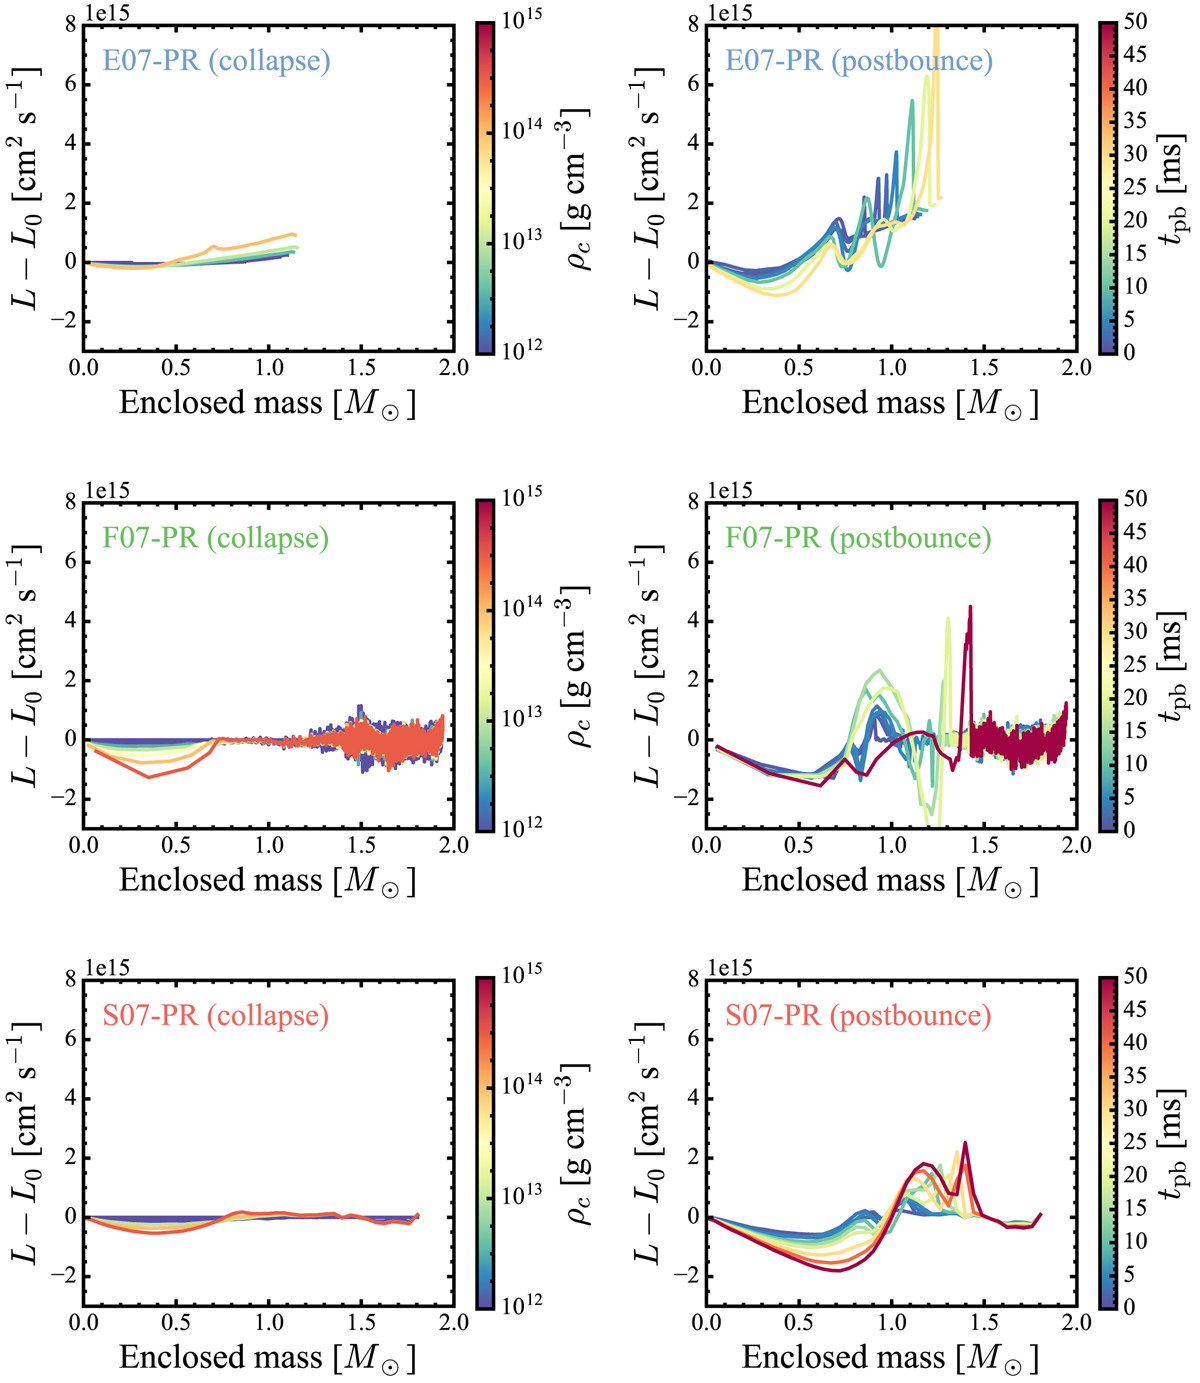
Specific angular momentum differences with respect to the initial specific angular momentum distribution at different central densities during collapse (left panels) and at different post-bounce times (right panels). From top to bottom panels, the represented simulations correspond to ELEPHANT, FLASH, and SPHYNX codes.
Current usage metrics show cumulative count of Article Views (full-text article views including HTML views, PDF and ePub downloads, according to the available data) and Abstracts Views on Vision4Press platform.
Data correspond to usage on the plateform after 2015. The current usage metrics is available 48-96 hours after online publication and is updated daily on week days.
Initial download of the metrics may take a while.