Free Access
Fig. 4.
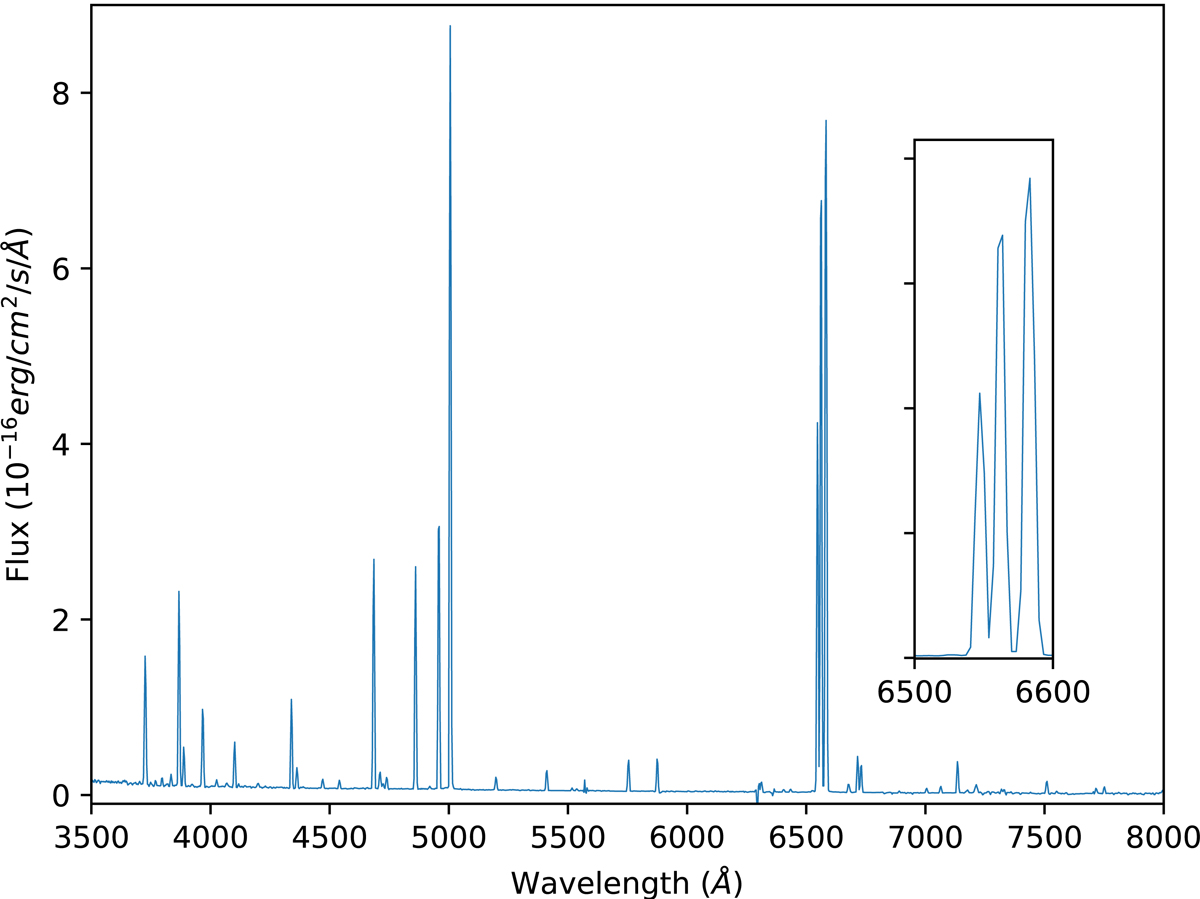
FORS2 spectrum of the nebula of M 3-2 taken with the 300V grism, a 1″ wide slit and an exposure time of 1800 s. The right inset shows the [NII] and Hα lines, illustrating the strong nitrogen lines.
Current usage metrics show cumulative count of Article Views (full-text article views including HTML views, PDF and ePub downloads, according to the available data) and Abstracts Views on Vision4Press platform.
Data correspond to usage on the plateform after 2015. The current usage metrics is available 48-96 hours after online publication and is updated daily on week days.
Initial download of the metrics may take a while.