Fig. 3.
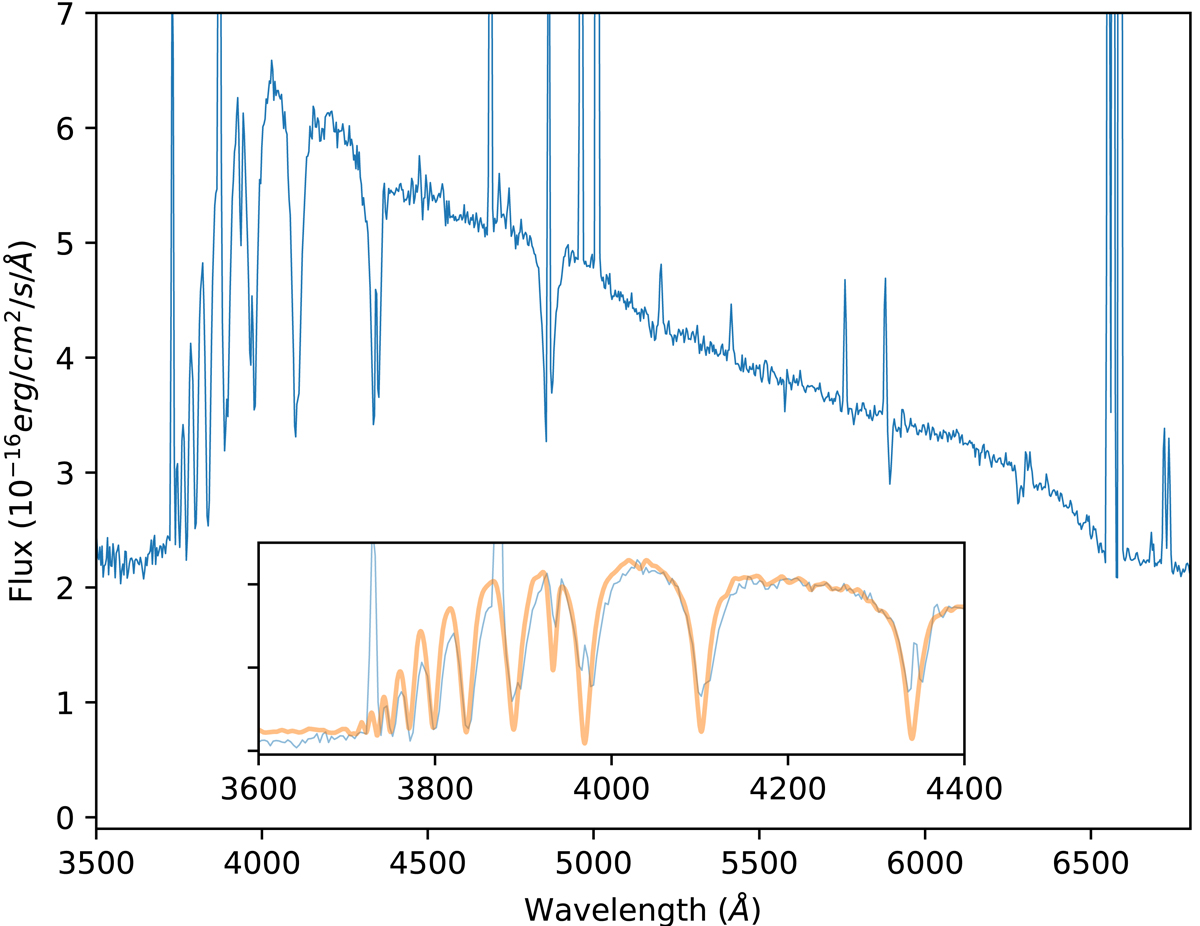
FORS2 spectrum of the bright central star of M 3-2 taken with the 300V grism. No attempt was made to remove the nebular lines. The inset shows a zoom in the blue part of the spectrum, with a synthetic spectrum corresponding to a model of Teff = 8500 K, logg = 4.0 shown in orange. As the stellar spectrum is affected by the nebular lines, the bottom of the lines are not well fitted.
Current usage metrics show cumulative count of Article Views (full-text article views including HTML views, PDF and ePub downloads, according to the available data) and Abstracts Views on Vision4Press platform.
Data correspond to usage on the plateform after 2015. The current usage metrics is available 48-96 hours after online publication and is updated daily on week days.
Initial download of the metrics may take a while.